Sunday, April 29, 2012

The when-to-sell decision


The when-to-sell decision has always been more difficult than the when-to-buy decision because the decision to buy only needs two conditions. We need to have the free cash and we need to have a compelling story. The when-to-sell decision has always been a historical nightmare for both professional and private investors because there are too many moving parts to consider. We have the micro or bottom up worries such as the compelling storey that has suddenly gone sour. Perhaps some chart pattern has negative implications. We also have the emotional baggage that compels us to sell a winner too soon and to hold on to a loser too long.

We also have the macro or top down worries such as the current crisis be it the never ending Euro-Zone problems or the threat of a slowing Chinese economy. Now we have the mindless chirping of the seasonal “sell” crowd pressuring investors into switching a good portion of their equity portfolios to cash.

The root of the problem is the failure to have an exit strategy in place at the time of the decision to buy. The exit strategy or stop loss option should never be based on changing fundamentals, otherwise known as the “compelling story” because the price decline will often lead the deteriorating business model. I am sure long tem investors in the shares of Nortel Networks Corporation or Research In Motion Limited would agree with this observation
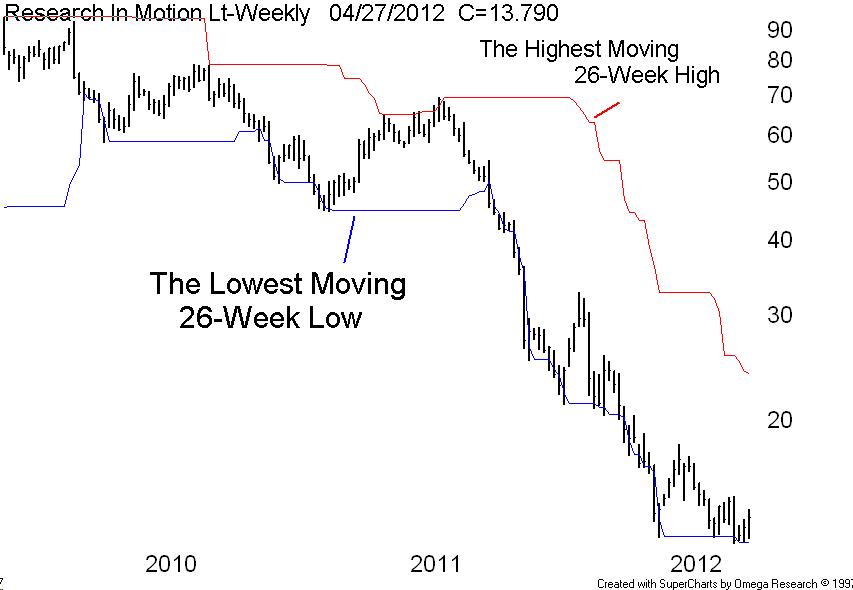
The Lowest 26-Week Low is a simple strategy with no math required. Set your stop at the lowest low of the past twenty six weeks. This is a moving 26-week window, so each week add the new week and drop the oldest week. Sell if the weekly price closes below the prior lowest 26-week low. Conversely, if the price is rising the lowest 26-week low will follow the stock upward which allows us to hold a rising stock in some cases for weeks, months or years.

Our chart this week is that of the weekly closes of Research In Motion plotted above the lowest 26-week low price channel. Note the numerous price declines below the 26-week price channel trough 2010 and 2011. No excuses for big losses here.


Thursday, April 19, 2012

Pending Dow Theory Buy Signal

According to Stockcharts.com Dow Theory is one of the oldest and most highly regarded technical theories. A Dow Theory buy signal is given when the Dow Industrial and Dow Transportation averages close above a prior rally peak. A sell signal is given when both averages close below a prior reaction low. According to Investopedia under Dow theory, a major reversal from a bull to a bear market (or vice versa) cannot be signalled unless both indexes (traditionally the Dow Industrial and Rail Averages) are in agreement.
For example, if one index is confirming a new primary uptrend but another index remains in a primary downward trend, it is difficult to assume that a new trend has begun.

Ok so let us chart the path of the industrials and the transports so far through 2012.

Note the December advance in both averages to their respective February peaks. They subsequently traded down to an April low which was higher then the prior December lows. Both then rally from their April lows but only to set up a bearish divergence with the industrials posting a new high at the April peak and the transports failing to exceed the February peak. This sets up a negative divergence condition.

Both averages then retreat down to test their respective April lows and hold. Note the higher low of the transports now setting up a bullish divergence condition. This divergence is first required in order to set up a possible Dow Theory buy signal. The buy signal is completed if and when both averages break up above their April peaks. That works out to about 13400 on the industrials and about 5500 on the transports. Now remember, Dow Theory signals are typically slow – about one third into a new bull so enjoy if we get the signal over the next week or two.

Friday, April 13, 2012

Opportunity in the trashed gassy producers

It has been difficult not to notice the bearish stampede out of the natural gas producers, the uranium miners and the gold miners. The perception among investors was that if the related commodity prices in natural gas, uranium and bullion were to continue to fall, there was no point owning the related producers.

The price of natural gas has been in free-fall for months triggering a bearish stampede out of the natural gas producers. Some producers have had their prices driven down to historical negative price deviations from their long term moving averages – see the example list with the name, symbol and the per cent negative distance below the 40-week moving average – the bigger the number the more likely a recovery

Advantage Oil & Gas Ltd. AAV -27.33
Birchcliff Energy Ltd. BIR -45.78
Celtic Exploration Ltd CLT -34.79
Delphi Energy Corp. DEE -34.52
Fairborne Energy Ltd FEL -33.79
Progress Energy Resources PRQ -16.44
Tourmaline Oil Corp TOU -20.93

These oversold gassy producers will eventually ignore the current reality and anticipate the eventual return to higher gas prices. I do recall the many of todays mid cap gold producers trading for pennies in 2001.