Monday, March 30, 2009

For GT Blog March 30, 2009

Hello fellow bloggers and stock market participants.

A word on Cycle Summation

This time I look at the shorter daily cycle and the longer intermediate stock cycle

Cycle Summation – the effective signals are flashed when the daily and the weekly cycles peak and trough together – in the example of the TSX Composite - the weekly cycle is still youthful and the daily is over extended

Weekly and daily peaks signal corrections - and weekly and daily troughs signal rallies

This week’s correction could be a buying opportunity

Thursday, March 26, 2009

For GT Blog March 26, 2009

Hello fellow bloggers and stock market participants.

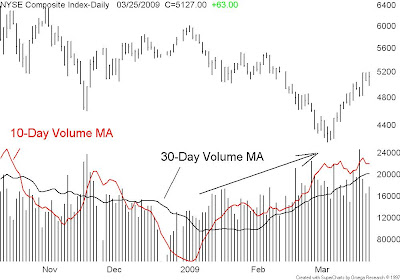
A few rules on volume

Prices and indices can fall on increasing or decreasing volume – the norm is for light volume in the early stages of a corrective period with gradual expansion as the correction matures

Prices must rise on rising volume or the move is considered to be false - the norm is for heavy volume in the early stages of the advance with a gradual reduction as the advance matures

Important junctures or turning points at tops and bottoms are usually accompanied by volume spikes

Below we see the NYSE Composite – daily with a 10 and 30 day volume oscillator – note the bullish volume expansion of the November low – the reduction into the January peak and now the bullish expansion during the March 2009 low

Tuesday, March 24, 2009

For GT Blog March 24, 2009

Hello fellow bloggers and stock market participants.

Lets us have some fun with a skill test on how to read a Dow Theory "Sell" signal

Was the "Sell" flashed at (A), (B), (C) or (D) and why?

Or none of the above

To learn the correct answer attend our Technical Analysis Level 1 seminar - to register go to: http://www.gettingtechnical.com/07_seminars/index.shtml


Dow Theory Seeking the top 2007-2008


Monday, March 23, 2009

For GT Blog March 24, 2009

Question: does a "doom and gloom" strategy make any sense?
Answer; the equity markets have no correlation to the current economy

How come Japan is rebounding?


If the US and global economies are tanking - forever - how come two important stock sectors are not making new lows?


Friday, March 20, 2009

For GT Blog March 20, 2009

Tips for responsible investing

Avoid "over-hyped" sectors - currently infrastructure EVERYBODY loves it

Avoid "trade by appointment" issuers - thin traders can be hard to dump

Avoid share buy-backs - usually done for the wrong reasons - companies do not shrink their way to greatness

The O'Leary Global Infrastructure Fund fails all three tests - exposure to and over-hyped sector, a thin trader and a share buy-back for the wrong reason

On a March 12 press release O'Leary Funds Management LP, the manager of O'Leary Global Infrastructure Fund today announced that the Fund has commenced a normal course issuer bid to purchase a portion of the outstanding trust units (TSX: OGN.un) on the Toronto Stock Exchange. The purpose of the normal course issuer bid is to provide the Fund with a mechanism to decrease the potential spread between the net asset value per unit and the market price of the trust units and to provide enhanced liquidity for the trust units. Under the normal course issuer bid, the Fund intends to purchase up to 469,010 trust units, representing 10% of the public float of the securities issued and outstanding.

Hello - is anybody home? We need more shares to increase liquidity - split the trust units and put the dough to work as promised - Let me help, SNC-Lavalin Group, Stantec Inc, Aecon Group Inc, Finning International and Fluor Corporation



Wednesday, March 18, 2009

For GT Blog March 19, 2009

Hello fellow bloggers and stock market participants.

Lets us have some fun with a skill test on how to read a popular technical indicator, the Moving Average Convergence/Divergence - better known as the MACD

We think the MACD is over-used and misinterpreted - so here goes

Question: The MACD signalled a "buy" on General Motors because?

(1) The red trigger line is above the MACD line
(2) The histogram is above the zero line
(3) Both the trigger line and the MACD line are both rising
(4) The buy is false because the trigger and zero lines are negative #'s
(5) All the above are wrong

If you selected (5) you would be correct – if not fellow readers maybe able to help you or you can also find out this and many more things at our Technical Analysis Level 1 seminar - to register go to: http://www.gettingtechnical.com/07_seminars/index.shtml


General Motors and the MACD

Monday, March 16, 2009

For GT Blog March 15, 2009

"To know and not act, is to not know" Gettingtechnical

We see signs of a global recovery when we examine the structure of the Sea Transportation stocks - most have bottomed and some are beginning new second up-leg bull marker advances

We consider the Sea Transportation stocks to be bellwethers for the global economy

Sea Transport Selections
Diana Shipping DSX $12.83
Dryships Inc DRYS $4.11
Frontline Ltd FRO $17.46
Nordic American Tanker NAT $24.97
Seaspan Corp SSW $8.80
Teekay Corp TK $13.96
Tsakos Energy Navigtion TNP $14.20

Below we have Seaspan Corp with a bullish higher low and a youthful change to outperform relative to the broad S&P500 stock index


An Emerging Recovery in Global Trade?

Thursday, March 12, 2009

For GT Blog March 12, 2009

The Recognition Point

Elliott wave (3) or - the second up-leg advance is usually the largest and most powerful wave in a trend. The news is now positive and fundamental analysts start to raise earnings estimates. Prices rise quickly, corrections are short-lived and shallow. Anyone looking to "get in on a pullback" will likely miss the boat.

A buying panic can occur when the prices in wave (3) exceed the peak of wave (1) sometimes called wave three's midpoint, "the crowd" will often join the new bullish trend.

I am assuming wave (1) to be the November 2008 to January 2009 advance

The last bull market recognition point occurred in May 2003

Note the TSX Comp "Recognition Point" at 9500 on the index - should be an easy target in this over-sold market


An Official Bull? …….. Soon

Wednesday, March 11, 2009

For GT Blog March 11, 2009

Lately the we hear the term “Too Big To Fail” in reference to the large U.S. money centres who failed to manage their risk when they engaged in financial engineering.

Sometimes the price of a stock or an index can rise or fall too fast for the move to be sustainable. This can occur when the price deviates too far from the mean – in this case the Dow Industrials and the Dow Transports our mean is the 40-week moving average

Currently the Dow Transports are sitting at a stunning 45 per cent under the 40 week MA – a modern record. In comparison the 911 terrorist attack collapse printed a negative 28 per cent below the 40-week

The Dow Industrials have the same over-sold condition currently 31 per cent under the 40-week - also a modern record

Friday, March 6, 2009

For GT Blog March 06, 2009

When the going gets tough - it is time for the technical analyst to table the ultimate technical weapon

The ultimate technical weapon is held in reserve until it the time is right to spring it. This could be the time, a time when a global recession threatens to be come a global depression. This according to the economists who look at the numbers on industrial capacity, non farm payrolls, housing starts, U.S. GDP and the Chicago PMI.

The ultimate technical weapon? -

The long term primary trend line - (always use a semi-log scale)

So, is the S&P500 a buy at 1600 or a buy at 680?


A Picture is worth 1000 words or (10,000 economist words)

Wednesday, March 4, 2009

For GT Blog March 04, 2009

Time for a BNN flash-back

We go back to a BNN Market Call visit on or about July 30, 2007 - I like many guests on BNN made some bad calls, but we can also get it right – this was an easy call.

The Dow had just popped above 14,000 for the first time ever and the future was so bright we all wore sunglasses

And why not, Potash was over $220, Commerce just under $100, CP at $87, Canadian Tire at $90, Manulife at $40 and Teck-Cominco was over $50. All was good except many technical analysts I know saw a problem.

Below is the graphics and comment Getting Technical sent to BNN on July 30, 2007 for a market call segment – displaying the North American financial indices violating their March 2007 lows as identified by the two support – resistance lines

I quote

“The Big Financial stocks are not participating in the current Dow Advance
Bearish implications – North American Financial Sectors violate the Feb 2007 lows”

Monday, March 2, 2009

For GT Blog March 03, 2009

Cycle Summation

All price movements are the simple addition of all active cycles. For example, a 20 day cycle is made up of two 10 day cycles and the 10 day cycles is made up of two 5 day cycles, etc.

All price patterns are formed by the interaction of two or more different cycles.

The longer monthly cycle maps out the longer term dominant theme and the weekly or intermediate cycle maps out the shorter trading theme

There are usually three weekly cycles in the bull skew of the monthly cycle

There are usually two weekly cycles in the bear skew of the monthly cycle

Cisco Sys Inc- the next weekly up should introduce the next long term bull