Friday, September 27, 2013

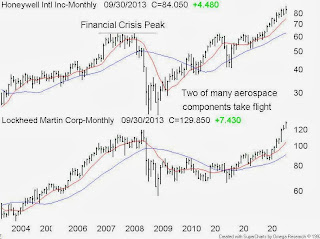
Aerospace is a dominant theme:


Dominant theme investing has been my focus for the last several years starting with the “echo” technology boom and then on to lumber and now aerospace. These sectors are still in youthful secular bull phases.

Below is the text I authored and published by the Toronto Star business on or about September 7, 2013.

----------------------------------------------------------------------

Traditionally financial planners and investment advisors have embraced two basic rules when advising clients on personal finance and equity investing

Never get divorced, and never buy an airline stock.

The never buy an airline stock rule is deep rooted and for good reason.

Investors have long nightmare like memories when it comes to the North American airline industry. In Canada we have infamous names like Air Canada, Wardair. Canadian Airlines, Zoom Airlines and Canada 3000. In the U.S. the list is too long for this space.
Industry experts have blamed the carnage on de-regulation, rising fuel costs, security costs and various global crises such as the technology bubble of 2000 and the financial crisis of 2008.

The AMEX Airline index (XAL) which is designed to measure the performance of highly capitalized companies in the commercial airline industry peaked in 2000 at the 160 level. By March 2009 the XAL was trading at the 16 level for a stunning loss of 90 per cent,

The dismal performance of the XAL is in sharp contrast to the success of the related commercial and defence manufactures and contractors. Names like he Boeing Company (BA), Honeywell International Inc. (HON) and United Technologies Corp. (UTX) are trading close to recent all-time highs.

Most notable is the list of the top North American manufacturing employers. Names like General Electric Company, General Motors Company, United Technologies Corp, Ford Motor Co., The Boeing Company, Lockheed Martin Corporation and Honeywell International Inc. are all related to trains, planes and automobiles,

The common theme among most of these names appears to be related to aerospace and made in North America.

Loosely defined, aerospace is branch of technology and industry that is shared by three major components, the defence industry, commercial aviation and space exploitation programs such as spaceships and satellites.

Bullish Investors in the aerospace sector have lately chosen to ignore that never buy an airline stock rule. In the U.S. the AMEX Airline index has soared 300 per cent from the March 2009 lows and locally Air Canada and WestJet Airlines Ltd, were among the top performers on the TSX in 2012.

According to Standard & Poor's Capital IQ global air traffic trends are looking positive. They claim the underlying drivers of the commercial aerospace industry are improving global economic growth, an emerging global middle class and the upgrade of an aging fleet of commercial aircraft.

The commercial and defence manufactures are awash with orders from airlines switching to new aircraft.

Some recent Canadian examples would be WestJet Airlines Ltd (WJA) reaching a preliminary agreement to purchase 65 737 MAX aircraft from Boeing Co (BA), and Bombardier Inc. (BBD.B) recently signing a letter of intent to sell 50 Q400 NextGen turboprop aircraft to the Russian state-owned industrial and defence conglomerate Rostec.

If an investor embraces the aerospace theme he or she will need to seek out the companies or investment products that will provide some exposure to the sector

In other words we need to engage in stock picking or seek out sector related exchange traded funds (ETFs).

At the moment there appears to be no commercial airline industry ETFs that would track the AMEX Airline index (XAL). Guggenheim Investments closed nine ETFs back in March 2013 due to lack of investor interest. One of them was the Guggenheim Airline ETF (FAA) which could be goods news to a contrarian investor.

In the U.S. there are several ETFs that will provide direct exposure to all components of the aerospace sector.

The NYSE listed iShares Dow Jones US Aerospace & Defence ETF (ITA) tracks the Dow Jones U.S. Select Aerospace & Defense Index. It has 33 holdings, to include stocks like United Technologies Corporation (UTX), Boeing (BA), Goodrich Corporation (GR) and Lockheed Martin (LMT).

Also listed on the NYSE is the PowerShares Aerospace & Defence ETF (PPA) which tracks the SPADE Defense Index. It has 51 holdings, to include Honeywell International (HON), United Technologies Corporation (UTX), Lockheed Martin (LMT) and Raytheon Corporation (RTN).

Here in Canada the ETF manufactures have avoided the space and so we have to engage in stock picking.

Currently there are only five TSX listed companies in the aerospace sector, CAE Inc. (CAE), Magellan Aerospace Corporation (MAL), Bombardier Inc. (BBD.B), MacDonald, Dettwiler and Associates Ltd. (MDA) and Héroux-Devtek Inc. (HRX)

Some of these names may not be suitable investments and you may need the advice of a fully licensed advisor before making an investment decision.


Friday, September 20, 2013

Looking at the U.S. New 52 week highs


A few posts ago I disused a few rules that apply to using the new 52-week high / low list as a strategy to screen stocks for buy or sell candidates. The new 52-week high / low list can also be used to measure the strength of the prevailing trend. For example in New York today we had 477 new 52-week highs and only 20 new 52-week lows. During a bear trend the new 52-week high / low list would be swamped with new 52-week lows.

It is important to also note the type of stocks making new highs – is it a bunch of speculative tech social media plays or are the names broadly based and of important leadership quality?

The names are impressive, SPDR Materials XLB, SPDR Technology XLK, SPDR Energy XLE, SPDR Industrials XLI, SDPR Health Care XLV just to list a few sector ETFs. Also I see more economy sensitive stuff like CSX, DD, ETN, GD, GE, FDX, GM, HON, SSW, TK, UTX and UPS. Note the chart of two important transport leaders FedEx and United Parcel both just posting new 52-week highs. By the way UPS last peaked in 2004 and FDX peaked in 2006 well ahead of the 2007-2008 financial crisis.

.

Friday, September 13, 2013

Some New TSX listed 52 week highs


A few posts ago I disused a few rules that apply to using the new 52-week high / low list as a strategy to screen stocks for buy or sell candidates. On the buy side I stated the first new 52-week high will not be the last. So always seek out stocks and ETFs that have made their first appearance on the new 52-week high list such as the BMO Junior Oil Index ETF (ZJO). Another example was ATS Automation Tooling Systems Inc (ATA) today posting another new 52-week high of $13.49 on Sept 9, 2013 the eleventh in a series that began on February 8, 2013 at $10.51.

Now at the close today there are a few names that are relatively new to the new 52-week high list.

Altus Group Limited (AIF)  $12.28 made its first appearance on the new 52-week high list back in July 19, 2013. This week’s close was only the fourth in the series.

Essential Energy Services Ltd. (ES) $2.80 made its first appearance on the new 52-week high list back in June 21, 2013 and this week’s new high was only the second in the series.

Helix BioPharma Corp. (HBP) $1.55 following a long protracted decline made its first appearance on the new 52-week high list at the close on Friday.

Transat A.T. Inc. (TRZ.A) $10.92 made its first appearance on the new 52-week high list back in June 28, 2013 following a long decline. This week’s new high was only the fourth in the series


Wednesday, September 11, 2013

The New Dow Jones Service Average


According to the S&P Dow Jones Indices the DJIA today serves the same purpose for which it was created – to provide a clear, straightforward view of the stock market and, by extension, the U.S. economy.

I wonder if these guys were on drugs when the keepers of the Dow Jones industrial average gave the boot to Bank of America Corp., Hewlett-Packard Co. and Alcoa Inc. and replaced them with the consumer and service related Goldman Sachs Group Inc., Visa Inc. and Nike Inc.  

Now there are only six companies in the Dow that make industrial stuff that lasts for more than a year namely, The Boeing Company, Caterpillar Inc., E. I. du Pont de Nemours and Company, General Electric Company, 3M Company and United Technologies Corp. The bulk of the Dow is now related to consumer and service companies to include food, financial and health care - along with three technology companies and two energy companies.

So we have the likes of Visa (and American Express Company). Nike, The Walt Disney Company, The Coca-Cola Company, The Home Depot, Inc., McDonald's Corp. and Wal-Mart Stores Inc. providing “straightforward view of the stock market and, by extension, the U.S. economy.” The “new” Dow needs a name change: to the Dow Jones Service Average.

No wonder China is winning -  

Monday, September 9, 2013

Some New 52 week high / low rules:


To day computers allow investors to scan stocks in order to produce a basket of candidates for purchase or sale. See can scan for fundamentals like ROE, revenue growth and other stiff like dividend growth. We can also scan for technical conditions such as moving average crossovers, price and volume changes and other stuff like P&F breakouts and divergence.

On the technical side one big overlooked tool is to scan the daily new 52-week high / low list. We also don’t need a computer because the business dailies do the work for us.

Technically there are a few rules that apply to the new 52-week high / low list.

The first new 52-week high will not be the last. So always seek out stocks and ETFs that have made their first appearance on the new 52-week high list such as the BMO Junior Oil Index ETF (ZJO). Another example was ATS Automation Tooling Systems Inc (ATA) today posting another new 52-week high of $13.49 on Sept 9, 2013 the eleventh in a series that began on February 8, 2013 at $10.51.

The first new 52-week low will not be the last. Never hold these, I note DirectCash Payments Inc. (DCI) posted a new 52-week low of $18.63 on Sept 9, 2013 the fourth in a series that began on August 9, 2013 at $21.29.

Always look for a theme in the new 52 week high /low list.

Energy seems to be one theme with BMO Junior Oil Index ETF (ZJO), Calfrac Well Services Ltd. (CFW), Suncor Energy Inc. (SU), Trinidad Drilling Ltd. (TDG) along with several other energy related stocks recently on the new 52-week high list.


Thursday, September 5, 2013

Still a Bull market:


Most modern bull markets (since the 1970’s) are quite long with an average length of about 2400 days. See table below. All bulls except the Aug 1982 – Aug 1987 bull were rebound bulls. A rebound bull is a long advance that follows a bear market that was caused by a crisis. 


The Oct 1974 – Nov 1980 bull was a rebound from the 1973 Arab Oil Embargo Crisis
The Dec 1987 - Mar 2000 bull was a rebound from the Bank Liquidity Black Monday Crisis
The Oct 2002 – Oct 2007 bull was a rebound from the Y2K Panic & Dot-com Crash
The Mar 2009 – to date bull was a rebound from the Global Financial Crisis

Average Bull Market Gain = 239%
Average Bull Market Length in Years = 6.49
Total # of Days Oct' 74 Through Aug' 13 = 13979 days
Total # of Bull Market Days Oct' 74 Through Aug' 13 = 11844 days
Total # of Bear Market Days Nov' 80 Through Aug' 13 = 2135 days
Total % of Bull Market Days Oct' 74 Through Aug '13 = 85%

In summary – the average modern bull (since the 1970’s) spans about 2369 days or 6.5 years.
The current bull now at 1586 days may run for another 800+ days.

The total amount of bull market days since October 1974 to date is about 11844 days.

Since Oct 1974 the S&P500 has been in a bull phase about 85% of the time