Monday, December 29, 2008

For GT Blog December 29, 2008

Do you need an ETF Portfolio Makeover?

Here is the problem

There are too dam many Exchange Traded funds – funds for water, alternate energy, infrastructure, crude, gold, natural gas, home builders, oil sands, REITS, large cap, small cap, growth, value, fundamental, currency and agricultural grains – I could go on

Keep it simple – go top down and study the bigger picture

The frame below is our monthly Global Rotation Table – own the top five and avoid the bottom five – rebalance quarterly. No Currency hedging because we want the diversification. Note the 20-year bonds hitting top 5 in March 2008 and the drops in the Europe, Pacific and Emerging markets 5-months ago

Look for the December 31 rebalance in early January

Tuesday, December 23, 2008

For GT Blog December 23, 2008

Will natural gas ever bottom?

Usually the stocks will lead the price of the related commodity be it bullion and the gold stocks or energy stocks and crude.

In the chart below the AMEX Natural Gas index is displaying a higher low when the related natural gas price is displaying a lower low. That is a positive divergence set up.

Some components of the AMEX index are , APACHE (APA), ANADARKO PETROLEUM (APC), CHESAPEAKE ENERGY (CHK), DEVON ENERGY CP (DVN), EOG RESOURCES INC (EOG), EL PASO CORPORATION (EP), NICOR INC (GAS), NOBLE ENERGY INC (NBL), NATL FUEL GAS CO (NFG), NISOURCE INC HLDG (NI), QUESTAR (STR), SOUTHWESTERN ENERGY (SWN), ULTRA PETROLEUM CORP (UPL), WILLIAMS COS (WMB) and XTO ENERGY INC (XTO)

Some gas may be good for you


Thursday, December 18, 2008

For GT Blog December 19, 2008

Here is a strategy for 2009 that may isolate you somewhat from systematic risk which is the market risk associated with equities.

I am referring to the dominant theme.

A dominant theme is usually associated with a long term secular trend that tends to ignore the smaller boom and bust business cycle. A secular trend is usually associated with innovation and the emergence of the "next big thing", be it the age of steam, the railroads, the automobile, transatlantic air travel, the microprocessor and the Internet.

The recent energy crisis triggered demand for fuel efficient aircraft, transit and railroad sectors. This is a global phenomenon with the big loser being the auto manufactures. Now pile on the global financial crisis and North America is facing massive job losses in the manufacturing sector. This crisis has in turn, Federal, state and provincial governments reacting by stimulating their economies with spending on Infrastructure.

Out dominant theme for 2009 is Infrastructure
This is one of several names to look at - contact your advisor

Saturday, December 13, 2008

For GT Blog December 14, 2008

The text below was submitted to a Globe Report on Business blog and I invite your comments

You can tell the news paper business is going though difficult times when business writers are forced to patronize advertisers

The ANDY HOFFMAN Friday's Globe and Mail December 11, 2008 leads with “Ned Goodman wants your battered, beaten and illiquid resource stocks.” The new venture called Ravensden Resource LP hopes the publicly traded fund will become a significant merchant bank to the devastated resource sector.”

In reality this an asset grab strategy pioneered by Sentry Select who only a few years ago created “instant funds” and “instant management fees” by enticing investors in income trusts to swap for a managed basket of income trusts.

Hoffman fails to explain why Goodman also wants the likes of Barrick Gold Corporation, Cameco Corp, EnCana Corporation, Imperial Oil and Petro-Canada. Are these so called “devastated” companies?

Hoffman also fails to address the suitability issue as required by securities law. There is no way a competent advisor would advise a client holding Imperial Oil to swap for a merchant bank holding the likes of Abacus Mining and Exploration Corp. to Zoloto Resources Ltd. (in spite of that juicy 3.2% commission for advising the swap).

I submitted an item to the Toronto Star advising against the swap and it was yanked because I refused to contact Ravensden to balance my views. I am not a reporter. I am an investor and as such am entitled to make investment decisions based of the information contained in the offering materials.
Thanks but no thanks – I will keep my Aurizon Mines shares.


Wednesday, December 10, 2008

For GT Blog December 10, 2008

Bullish on gold?

Then what to buy - gold or the gold stocks?

Last week an "expert" on BNN advised the viewers to only buy physical gold and to take delivery - because you can't trust any form of paper in this crazy world

That had to be the most lunatic fringe advice ever tabled on national television

Here is the scenario if things get so bad any form of paper currency - to include gold stocks, and gold trusts - become worthless.

Your family is the only one in town with gold bullion stashed in the fruit cellar.

You venture out to trade some gold for food and other essentials for living.

An angry mob will ambush you - steal your gold and loot your home for the rest.

Relax - have a beer - the gold stocks are fine

Will that be bullion or paper?

Friday, December 5, 2008

For GT Blog December 05, 2008

There is a slow and growing trend for risk capital returning to equities - Bids return to Research In Motion following the maker of the BlackBerry's call on Tuesday night to cut its quarterly profit estimate as sales slow, margins narrow and a stronger U.S. dollar compresses revenue.

RIM is has over the past few days began to out perform its peer ETF SPDR Technology (XLK) with higher prices in spite of bearish fundamentals - a classic bottom scenario

RIM in US$


Monday, December 1, 2008

For GT Blog December 01, 2008

Canadians have their own distinct identity - unlike all other nationalities.

We quietly stand in line at banks.

We quietly sit in line at the Tim Hortons' Drive Trough

And….

We all own commodity stocks, mining, potash. oil and gold

Dare to be different!

There are signs of money moving quietly into the Health Care sector - Biovail - see chart below is only one example. For other recovery candidates in the Health Care sector consult your advisor or ask my kid.

Ask Darren: email Darren Carrigan dcarrigan@union-securities.com


Recovery Candidate Biovail


Thursday, November 27, 2008

For GT Blog November 27, 2008

A word on Technical Indicators

I was never a squiggly line guy, studies like Average Directional Index (ADX), Bollinger Bands, Moving Average Convergence/Divergence (MACD), Moving Average Envelopes, Parabolic (SAR), Relative Strength Index (RSI) and Stochastic Oscillators can be messy.

I like “clean” studies like divergence and trend lines.

Price divergence between two plots will occur when one fails to follow the other to a new trading high or low – note the failure of the TSX Energy Index to follow crude to new highs in mid July – setting up a “sell” signal.

Now note the failure of the TSX Energy Index to follow the price of crude to new lows over the past several days and in turn setting up a “buy” signal.

Bill Carrigan

Bullish Positive Divergence for the Energy Stocks

Friday, November 21, 2008

For GT Blog November 21, 2008

Opportunities in Natural Gas plays?

On a relative basis natural gas is much stronger than crude

The strategy would be to focus more on the natural gas producers and less on the crude producers. For a list of gassy producers and gassy income trusts, email Darren Carrigan dcarrigan@union-securities.com

A higher risk play would be the Horizon Beta-Pro Natural Gas Bull (TSX-HNU) - be careful, this product is VOLATILE


Natural Gas Vs. Crude

Monday, November 17, 2008

For GT Blog November 17, 2008

A word on Double Bottoms

The double bottom is a major reversal pattern that forms after an extended downtrend. The pattern is made up of two consecutive troughs that are roughly equal, with a moderate peak in-between

Sometime the right bottom is higher than the left bottom – but the volume must be greater on the left bottom in order to be valid

Caveat: Our Encana example is probably valid but is flawed in that the lows are very close together but the volume pattern is compelling


Bill Carrigan

Wednesday, November 12, 2008

For GT Blog November 12, 2008

Here we are at 3pm Wednesday November 12 and the TSX Composite is down 476 points - and when I look at the most actives I see nothing but red ink

Wait a minute - the forth most active - Bombardier is unchanged

Could it be the market is waking up to the beginning of a new dominant theme? A theme that will replace an old dominant theme?

The "old" dominant theme was the post war automobile - super highways and urban sprawl boom - and is now a broken model

The new dominant theme is one of mass transit - subways and commuter trains
The Bomber is the beneficiary and the global auto manufactures are the bag holders.

Wednesday, November 5, 2008

For GT Blog November 05, 2008

Technical Indicators - when, how, why

One of to-day's most popular and over-used technical study is the MACD (Moving Average Convergence/Divergence): An indicator using the difference between two exponential moving averages. The difference is plotted as an oscillator.

It is best used on WEEKLY charts

The problem is most investors use the MACD incorrectly and will get trapped by a false move

The best way to use the MACD is to look for a divergence set-up.

That means the PRICE makes a new high and the MACD fails to move to a new high (bearish)

OR - the PRICE makes a new low and the MACD fails to move to a new low (bullish)

Note the bullish MACD setup on Rogers

Friday, October 31, 2008

For GT Blog October 30, 2008

This goes in the "I can't believe I said that file."

Follow this link to re-visit my last appearance on BNN on July 3, 2008

http://watch.bnn.ca/market-call/july-2008/market-call-july-3-2008/#clip64272

I reminded the viewers we were in a bear market and made comments on commodity sensitive stocks and the current credit crisis.

- I set crude's "tipping point" at $130
- Energy stocks have topped - the stocks are ignoring higher crude prices
- Commodity stocks such as AGU & POT are over loved - too many bulls
- The bad news in the financials will drag on for 6-months
- It will end when a major institution goes bust

Bill Carrigan
Disclosure: This is a self-serving, shameless and conflicted piece of self-promotion

Sunday, October 26, 2008

For GT Blog October 25, 2008

Technical analysts want to know three things

- Is the price in an up trend?
- Is the price in a down trend?
- When will it reverse or change trend?

A reversal pattern can be bearish or bullish, depending upon whether it appears at the end of an uptrend (bearish engulfing pattern) or a downtrend (bullish engulfing pattern).

The first day is characterized by a small body, followed by a day whose body completely engulfs the previous day's body.

At the close Friday October 24, 2008 many gold stocks completed a bullish engulfing pattern

Candlestick charts provide graphic reversal patterns. The Candlestick Pattern below is a good example of a Bullish Engulfing Pattern – note how the white body “engulfs” the previous day – a small down day black body

Bill Carrigan

Thursday, October 23, 2008

For GT Blog October 23, 2008

There is always a bull market out there - somewhere

Observation

In the capital markets when something goes bad there is an opposite reaction elsewhere and something else goes good

Our Bullion / Gold Stock model below should be another popular model

The last signal was a sell-gold-stocks and buy-bullion call in January 2008

The steep advance on our RA departure analysis suggests the bearish stampede out of the gold stocks is over-done


Bill Carrigan

Monday, October 20, 2008

For GT Blog October 20, 2008

There is always a bull market out there - somewhere

Observation

In the capital markets when something goes bad there is an opposite reaction elsewhere and something else goes good

We are getting requests for our sell-this and buy-that models and we plan to publish them more frequently

Our own Crude / Energy Stocks model below should be another popular model

Caveat - the current return of the energy stocks to out perform is a bear market rally that could run through December 2008 - enjoy but be prepared to exit the group

Bill Carrigan

Friday, October 17, 2008

For GT Blog October 17, 2008

There is always a bull market out there - somewhere

Observation

In the capital markets when something goes bad there is an opposite reaction elsewhere and something else goes good

We are getting requests for our sell-this and buy-that models and we plan to publish them more frequently

The Gold / US Dollar model below should be another popular model

Bill Carrigan

Tuesday, October 14, 2008

For GT Blog October 13, 2008

More on Crisis – What Crisis?

Well - you have two choices

Buy some gold bars, and hide in mommy’s basement with your latest scary issue of the Globe’s Report on Business

Or:

You can look for stuff that was sold by investors who now are hiding in mommy’s basement

The TSX Information Technology sector has been sold down to the Head & Shoulder neckline built through the bottom of 2002-2003


Friday, October 10, 2008

For GT Blog October 10, 2008

Our Own Bull - Own Bear signal is still at a negative 3 Own Bear mode

Important - this model is not intended for speculation but rather to apply - form time to time a portfolio insurance product.

A portfolio that is insured or protected (to some degree) from market risk when non-correlated assets are added to the mix of components.

This strategy avoids the expense of selling and then buying back multiple stock positions.


Bill Carrigan

Wednesday, October 8, 2008

For GT Blog October 08, 2008

The problem with gold is that from time-to-time it trades like a commodity and then trades like a safe-haven currency

18-months ago safe-havens were the big U.S. multi-nationals - this pushed the DOW to all time highs

6-months ago safe-havens were the U.S. and Canadian T-Bonds

Now gold is the latest safe-haven and our chart below illustrates the transition of gold from a commodity to a currency

On August 29, 2008 our relative analysis study Binary_RA6 has flashed an "own gold" signal

Bill Carrigan

Monday, October 6, 2008

GT Blog October 06, 2008

The three stages of a bear market

Disbelief - the 2006 US housing bubble is brushed off as an isolated event - the housing stocks collapse but the broader indices advance

Worry - the Sub-Prime mortgage "problem" widens and in 2007 the Financial stocks sink - the financial crisis spreads into Global markets and the FED steps in

Panic - investors fear to own any asset and sell at any price to raise cash - The activity over the past 6 trading sessions is the panic

Strategy - do not sell now and STOP WATCHING BUSINESS TELEVISION!


Bill Carrigan


*Reminder there will be a GT seminar held on Tuesday October the 21st in Oakville. For more information click here http://gettingtechnical.com/07_seminars/index.shtml

Wednesday, October 1, 2008

GT Blog October 1 2008


Today we are looking for stocks that displayed strength during the Monday panic sell off. Our definition of strength is the ability to post a Tuesday close above the close of last Friday.

The filter was run and 46 Stocks were found. The stock prices had to have been $2.25 or greater to make the cut.


Monday, September 29, 2008

For GT Blog September 29, 2008

According to Horizons BetaPro Management Inc. the Horizons BetaPro S&P/TSX 60 Bull+ ETF (HBP 60 Bull+ ETF) and the Horizons BetaPro S&P/TSX 60 Bear+ ETF (HBP 60 Bear+ ETF) seek daily investment results equal to 200% the daily performance, or inverse daily performance

Our proprietary relative performance oscillator – the Binary_RA6 can identify a pending turning point in these inverse products.

This allows for various strategies to reduce or increase long exposure – or to apply portfolio insurance when anticipated

We own the Bull when above Zero and own the Bear when below

Friday, September 26, 2008

For GT Blog September 26, 2008

Quarterly portfolio window dressing is one of many immortal Jaberwock-like creatures that roam the granite canyons of the Wall & Bay Street jungle, sending inappropriate signals to unwary investors

Basically at the end of each quarter portfolio managers blow out falling stocks at any price in order to pretend they never owned them.

This could present opportunity for investors seeking out stocks victimized by this silly charade

The names of some victims - Ace Aviation, Algonquin Power, Cameco, Can Tire, Cascades, Forzani, Hudbay, Harry Winston, Jean Coutu, MacDonald Dett, MDS, Norbord, Nortel, Petro Canada, Sherritt and Transat AT

Bill Carrigan

Wednesday, September 24, 2008

For GT Blog September 24, 2008

The current US FED bailout plan was raised concerns about the effect of too many dollars being printed to "fix" the problems on Wall Street.

Gold and the gold stocks could be a beneficiary of a pending return to an inflationary period

Perhaps the safer way to participate in a probable rally in the precious metals complex would be to seek out the oversold silver miners

Note our Silver vs Gold chart below - clearly displaying the oversold condition of silver

Bill Carrigan

Friday, September 19, 2008

Financials and Elliott Wave

A few observations on an Elliott Wave corrective wave (2) Low

Wave 2 often retraces most of wave 1’s upward move.

Often a sharp decline.

Fundamentals remain negative, perhaps less negative.

At the bottom, investor psychology is usually more bearish and negative than at the
beginning of wave 1, creating a positive divergence between momentum and sentiment.

The bottom of wave 2 is the safest entry point in the cycle.


Note the current higher lows in the Us and Canadian financial ETFs - The 2007-2008 financial bear is history


Bill Carrigan

Monday, September 15, 2008

UPS and the Bear

For GT Blog September 15, 2008

Years ago market participants used to say

"What is good for GM was good for America"

Then we dropped GM and went to IBM - we called IBM "Big Blue"

"What is good for Big Blue is good for America"

Forget all that - the real bellwether for the U.S. economy is UPS

That is because UPS is the shipper of choice for Main Street

The shares of UPS peaked last mid 2006 effectively forecasting the 2007 - 2008 bear

Now UPS is about to forecast the end of the 2007-2008 bear


Bill Carrigan

Tuesday, August 26, 2008

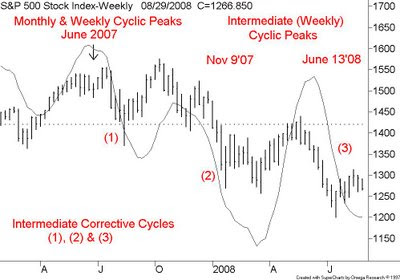
Intermediate Corrective Cycles

A little primer on stock market cycles

As measured from trough to trough the short daily trader cycle spans about 22 days and is used for timing entry and exit points

As measured from trough to trough the intermediate weekly cycle spans about 26 weeks and is used for sector rotation strategies

As measured from trough to trough the longer monthly cycle spans about 42 + - months and is used for long term investment strategies

Below is the intermediate cycle of the S&P500 - a three cycle bear is typical and the third and final cycle is now almost concluded

Bill Carrigan

Tuesday, August 19, 2008

TSX REITs

For GT Blog August 19, 2008

The TSX REITs stock group is displaying early signs of improved relative performance when compared to the broader TSX Income Trust Index

One could enjoy the TSX listed iShares CDN REIT index or select individual REITS

The selections below are components of the index

Company Name
Boardwalk Real Estate IT. --(BEI.UN)-- Western *
Calloway Real Estate IT. --(CWT.UN)-- Wal-Mart
Canadian Apartment Prop. --(CAR.UN)-- Ontario
Canadian Real Estate IT. --(REF.UN)-- 1/2 western
Chartwell Seniors Housing RE --(CSH.UN)-- Not a REIT
Cominar Real Estate IT --(CUF.UN)-- Quebec
Dundee Real Estate IT --(D.UN)-- Western *
Extendicare RE Investment --(EXE.UN)-- Ontario
H&R Real Estate IT --(HR.UN)-- National
InnVest Real Estate IT --(INN.UN)-- Eastern
Primaris Retail RE Investment --(PMZ.UN)-- Retail
RioCan Real Estate IT --(REI.UN)-- National

**** We would avoid Western based REIT


Saturday, July 26, 2008

Under-loved under-owned

For GT Blog July 25, 2008

The recent out performance of the US Health & Biotech groups should get the TSX Health Care Index on the move to recovery – note the support at the 34 level on the TSX Health Care Index – look for an initial bounce to 42 followed by a new bull market

This group is currently under-loved and under-owned

Some components:

Company Name Symbol
Biovail Corporation BVF
Cardiome Pharma Corp. COM
CML HealthCare Income Fund CLC.UN
MDS Inc. MDS

Other candidates
Angiotech Pharmaceuticals ANP
Patheon Inc PTI
QLT Inc. QLT

Tuesday, July 22, 2008

Income Trust Models

According to the Boston Pizza web site:

"Boston Pizza is a progressive company that continually sets industry standards. Our award winning reputation combined with revenues over $647 million dollars and an overall annual growth rate of 21% in 2006, makes us Canada’s Number One Casual Dining Brand."

According to the Keg Royalties web site:

"Vancouver-based Keg Restaurants Ltd. is the leading operator and franchisor of steakhouse restaurants in Canada and has a substantial presence in select regional markets in the United States."

The chart below suggests the income trust model is not working


Take me to your Leaders - then again - maybe not

Friday, July 11, 2008

The Perfect Storm

For GT blog July 11, 2008


Finally - an opportunity for the gold bugs to finally be right

The recent bounce in bullion is accompanied by a weaker U.S. dollar and a return of the U.S. 10-year note yield back under the 4% level

Add in this morning’s collapse of the U.S. financial bellwether Fannie Mae (FNM) which will bring renewed crisis and panic back to the U.S. financial complex.

We now have the perfect storm for a SHORT but profitable flight into the gold complex

The gold complex should (finally) be a beneficiary of the current banking and liquidity crisis.


The Perfect Storm for the Gold Bugs

Thursday, July 3, 2008

In search of the Bellwthers


In investment lingo a bellwether is a stock that can lead us to safety or lead us to slaughter

The term is derived from the Middle English bellewether and refers to the practice of placing a bell around the neck of a castrated ram (a wether) in order that this animal might lead its flock of sheep.

Two U.S. bellwethers Fannie Mae and General Electric


Important Price Levels

Friday, June 27, 2008

PDN vs TSX

For GT blog June 27, 2008

In search of the ultimate technical indicator.

Over the course of a year I may conduct several technical analysis presentations in addition to my teaching duties for the Canadian Securities Institute.

It is during these sessions I can always count on someone asking me for the perfect indicator - something that works all the time - a true "stealth" indicator. One would think with all that computing power along with cheap and plentiful data some mathematical genus would have invented the ultimate technical study.

I confess now to have the perfect indicator - I have had it for years – I now have under much personal anguish personal guilt decided to come clean and share it with you.

The perfect indicator is ---- The Straight Line

No computer needed - just a straight edge and a pencil


Trend Lines in Action

Monday, June 23, 2008

Cycles

A few comments on cycles

The long cycle dominates the shorter cycle - we prefer the intermediate or weekly cycle for our work - the cycle can generate about two trades per 12-month window

In most markets there is a high degree of sector cyclic commonality - but sometimes we will enter a period when there is cyclic opposition

Currently the gold complex is operating in cyclic opposition to the broader stock indices.


Cyclic Opposition in Action - Gold Stocks & the S&P500


Wednesday, June 18, 2008

Two Bellwethers

Are you feeling lost - adrift and without focus?

If so, that is because you are - lost, adrift and without focus.

Perhaps you look too much at "fundamentals". A fundamental analyst will study what a stock SHOULD be doing - and a technical analyst will study what a stock IS doing.

(wisdom thanks to Merv Burak)

We let the markets talk to us - a good example is the important chart below

There is a very important Elliott Wave component in play here - can you spot it?


Two Bellwethers - Important Test of Lows

Monday, June 16, 2008

June 16th

For GT blog June 16, 2008

Our weekly Sector Rotation tables display the TSX Industrials in the top FIVE ranked sectors over the past several weeks

Some components
Company Name Symbol
ACE Aviation Holdings Inc. ACE.B
Aecon Group Inc. ARE
BFI Canada Income Fund BFC.UN
Bombardier Inc. BBD.B
CAE Inc. CAE
Canadian National Railway Co CNR
Canadian Pacific Railway Ltd CP
Finning International Inc. FTT
Jazz Air Income Fund JAZ.UN
Newalta Income Fund NAL.UN
Russel Metals Inc. RUS
SNC-Lavalin Group Inc. SNC
Stantec Inc. STN
Superior Plus Income Fund SPF.UN
Toromont Industries Ltd. TIH
Transat A.T. Inc. TRZ.B
Transcontinental Inc. TCL.A
TransForce Inc. TFI
WestJet Airlines Ltd. WJA
Westshore Terminals WTE.UN


Thursday, June 12, 2008

Nortel

For GT blog June 11, 2008

This is a test for your advisor

A weak advisor will always recommend stocks that we all love to own.

So it is easy to pick the phone and say, "Mr. client I suggest that we buy some EnCana."

An easy sale because EnCana is now the biggest and greatest company ever in the history of Canadian investing

A strong advisor will suggest to buy the shares of a company that is hated and is thought to be owned by "uninformed" investors.

Nortel is one of the most hated stocks in Canada (well maybe Air Canada)


Be brave - Be a somebody


Friday, June 6, 2008

A New Idea

Sometimes an astute investor will accumulate stocks others love to hate

That is never easy - anyone can say I love EnCana the greatest Canadian stock of all time but if you say you just bought Air Canada - you will be scorned and not allowed onto some golf courses.

Your own dog may bite you

Some fundamentals for those CFA's out there - people have to use aircraft if they wish to fly.

OK now for the technical picture
Elliott Wave suggests that if the price stays above a prior low and the news and fundamentals are worse we have divergence between price and sentiment - a bullish event. Not the current price is still above the early 2008 low in spite of the current booming energy costs


Be brave - Be a somebody

Monday, June 2, 2008

Some Gold

For GT blog June 02, 2008

We are not Gold Bugs

The problem with gold bugs is their anger and nastiness to those who dare disagree with them

We think that gold stocks are excellent trading vehicles but for the most part crappy investments

Now for those of you who feel compelled to buy a gold stock we can suggest two names

Both names below have just completed a long term bear - mid 2006 to date and are now just signalling a new bull cycle - the leader is Eldorado (for the bold) and the laggard Gammon (for the shy).


The Gold Stock Selections - a leader and a laggard


Friday, May 30, 2008

Crude

One way to find the crude Tipping Point

The crude TIPPING POINT defined:

The crude tipping point is the price level that when crossed, will have a negative impact on not only the U.S. economy but perhaps the Global Economy.

Answer – monitor the Dow Transports – as we can see below the Transports seemed Ok with $80 crude last July 2007. Note the recent rally hit a wall at the old top as crude topped $130

The Transports will not tolerate crude over $130 – the tipping point

Bill Carrigan

Tuesday, May 27, 2008

General Electric

For GT Blog May 27, 2008

A look at Dow component General Electric

Forty years ago the rule was – what is good for General Motors was good for the Dow

Twenty years ago the rule was – what is good for IBM was good for the Dow
(remember when IBM was called Big Blue)

Now the rule is – what is good for General Electric is good for the Dow

We do not like GE under $31.75 – a bad omen

Question - What is wrong with GE?

Answer – I don’t care, run first, ask questions latter.

Bill Carrigan


Friday, May 23, 2008

Dow

A few questions from Dr. Dow

Is your favourite stock going nowhere?

Is it a little harder to find stocks that go up?

Do you lately feel like a salmon swimming up-stream?

Have the stock gods turned their back on you?

Well chin up - its not you - its the markets

We are in the beginning of an intermediate cyclic down trend. You see the intermediate stock cycle normally spans about 24 weeks trough to trough. The bull skew is about 16 weeks and the bear skew is about 8 weeks giving us a target low of mid July 2008

Caveat - cycle work is good for time and duration - it sucks on magnitude

The Intermediate Stock Cycle

Wednesday, May 21, 2008

Dow Transports

A new all time high for the Dow Transports - just before a reversal sent the group back under the important 5400 level

A possible bull trap
Normally a one-day reversal is not enough to call a significant juncture - BUT - this reversal occurred at the threshold of an all-time high

Friday, May 16, 2008

Travel & Aerospace

For GT Blog May15, 2008

On The Travel & Aerospace Theme

Below is the technical picture on Bombardier with the upside price targets.

Note the huge inverse head & shoulder pattern

Normally we are quantitative and technical guys but we now serve up some fundamentals on Bombardier for those CFA’s out there

So far this year I can’t find a parking spot at any GO Station parking lots – seems commuters are being forced out of their cars by high gas prices

We think this is good for Bombardier – OK were done

Other Travel and Aerospace


CAE, Honeywell, Onex


Bill Carrigan

Disclosure –My Family and I own BBD.B

Tuesday, May 13, 2008

MLY

Still bullish on commodities?

They scare the hell out of us - too late for the coal stocks - too late for the energy stocks

Gold is falling apart

We need more laggards - those things overlooked by crude bulls

We ran a price/volume filter and found a good looking chart

Take a look at TSX listed Sprott Molybdenum Participation Corporation (MLY)

We always get excited when we see an inverse Head & Shoulder reversal pattern

Caveat: Disclosure - the author is long the Sprott Molybdenum warrants.

Confession: This is a bad way to play the stock - I should have just bought the stock.

Friday, May 9, 2008

More Energy

Still bullish on energy?

Too late for the coal stocks - so why not look at the energy laggards such as uranium?
You uranium bellwethers are Cameco (CCO) and Uranium Participation (U) - the buy signal was confirmed when Uranium Participation broke above resistance @ $9 - see chart below