Technically
there are several problems with the tape with one issue being the failure of
the NYSE advance / decline line to hold above the breakout of early December
and the other being the current bearish setup of a pending Dow Theory “sell”
signal.
There
is a lot of components to Dow Theory but I will just focus on the averages must
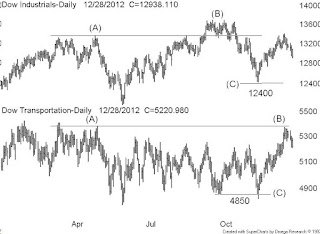
confirm part. Take a look at our Dow Industrials over the Dow Transports chart
where I have marked the mid 2012 peaks at (A). Now note the subsequent rally to
new highs by the Industrials to (B) and the failure of the Transports to
confirm at the lower plot (B). That alone is not a Dow “sell” signal because while
it sets up a negative divergence condition we still need the two averages to
confirm the “sell” by subsequently dropping below the lows at (C) which is
12400 on the Industrials and 4850 on the Transports. If we get the “sell” adopt
a low risk strategy through 2013.


4 comments:
I disagree with your call on apple to go higher. Vied on a monthly chart it is up already 700 percent in a few years and already far extended from it's long term moving averages. What happens now usually is a strong snap back to correct this overbought condition. To go long here on apple is just poor analysis.
Bill, I watched the market call last Monday and you suggested that the bull is " aging". Do we still have room to run? What's your view on gold after the latest comments from Fed?
Hello All
For edmagee
On BBD.b it is important to get the box size correct and so under $5 it should be 10 cent units and then over $5 go to 25 cent units all with a 3 box reversal. Now on a very long term P&F there is great support in the $3 level and also an eight year series of higher lows – 2004, 2009 and 2012. There is some upside at $4.50 and then $6.
Hello Andy Ottawa
Yes the DJIT did post a new 52-week high but the DJIA did not and yes the NYSE A/D line did break to a new high but there is still a danger of a bull trap here – see my last post
Hi DH12
On Apple – when plotted on a semi log scale AAPL found support at a 10 year primary trend ($500) line and so has not violated the 2002 – 2012 advance – I have no idea what you are using as a long term moving average – my analysis is based on a very long term 15-y monthly chart.
Hello to Anonymous
Yes at about 40 months the current bull is aging – I don’t think a crash buy rather a messy period of sector rotation – on gold there is major support at 1580 (on a P&F) so we should rally from here
Thanks to All
Bill Carrigan
I am not using a semi log chart. IMO it's not needed in this case. Apple may get an earnings bump this month but it will be all weakness going forward. I am also looking at the long term monthy chart which in 2012 went parabolic. It is very far from it's 200 month Moving average and will correct sharply. And remember this about technology stocks in general.
If Apple can go from not even being in the market to the best phone on the market in two years, the barrier to entry is pretty low, i.e., there is very little first mover advantage in this market judged by how fast the technology is reinventing itself. In other words, today`s leader can be tomorrow`s also ran faster than Moore`s law can bat an eye.
Invest here in apple at your own risk
Post a Comment