Tuesday, December 30, 2014

A look at the gold complex:


In order to technically claim a plot – such a gold - has a positive trend change we need a few conditions

First we need a recognized down trend which is a series of lower highs and lower lows. Then we eventually get a rally from a higher low – but the rally needs to break above the prior lower high (the pivot) in order to confirm a positive trend change. If this occurs on a daily chart we get a trade. On a weekly chart the pivot is higher – but you have to start somewhere. The attached chart tells all – a down trend, a higher low and a pivot target


Friday, December 26, 2014

December and Seasonality


The only thing I know about seasonality is during an uptrend you buy low – sell high and then buy back even higher. In a downtrend you sell high - buy low and then sell even lower.

December more than any other month is loaded with seasonality folklore which is recycled annually in the business dailies. The books on seasonality are published every season and basically say the same thing as last season. The seasonality bible is the Stock Trader’s Almanac first published in 1967. This book allowed Mr. Hirsch to distil his lifelong interest in stock market history, cycles and patterns into a practical working tool for the average investor. It was the first compilation of the market’s seasonal trends and tendencies combined with a calendar and laid out for use by non-institutional investors.

One of the mid December seasonal plays is the “free lunch” wherein investors tend to get rid of their losing stocks near year-end for tax purposes. This often has the effect of driving the prices down to near 52-week lows. The Stock Trader's Almanac has shown that NYSE stocks selling at their lows on December 15 will usually outperform the markets through the following late January and early February. I assume the TSX would follow the same model.

Next is the Santa Clause rally which is a short advance within the last 6-days of December and into the first 2-days of January. The Almanac quote is “If Santa Claus should fail to call, Bears may come to Broad and Wall.”

Then we have the January Barometer which states that as January goes, so goes the year. The 2010 Almanac claims only 5 errors since 1950 for a 91% accuracy ratio.

Finally we have the January Effect which is the tendency of the small caps to out-perform the large caps through January as measured from the Russell 2000 vs. the Russell 1000 index. The Almanac post several reasons for this seasonal event.

I will likely post the same thing next year


Wednesday, December 17, 2014

The Talisman mercy killing:


A clip from BNN - The TSX ended more than 1 percent higher on Tuesday boosted by a 46 percent surge in Talisman Energy shares after Repsol said it would pay $13 billion for the producer; and - according to the business media the CEO of long-struggling Talisman Energy Inc. (TSX:TLM) says a multibillion-dollar takeover by Spanish energy giant Repsol is the best possible outcome for shareholders and he expects the deal will receive federal approval. To recap - Talisman Energy Inc. (TLM) closed Dec 16 at $ 8.84 up 2.87 for a one day gain of 48.07%.

That reminds me of a business headline in the Calgary Herald – September 21, 2012 (I kept the paper) “Nexen CEO excited by deal,” referring to the July takeover offer by the Chinese CNOOC - the stock popped about 50 percent on the news. Those lucky shareholders! The reality is that long term investors actually lost money on both deals. In the case of Nexen the post deal close of about $17 was actually lower than he mid 2006 prices. In fact the only winners were the Nexen buyers of the lows of 2008 and 2011. In the case of Talisman the only shareholders who made money were the buyers during the recent eight week collapse beginning in October 2014. There could be more exciting times ahead for long term energy investors

Thursday, December 11, 2014

Tesla and the bearish rising wedge:


According to Investopedia; “a rising wedge is a bearish pattern that signals that the security is likely to head in a downward direction. The trendlines of this pattern converge, with both trendlines slanted in an upward direction. As the price moves towards the apex of the pattern, momentum is weakening. A move below the lower support would be viewed by traders as a reversal in the upward trend.”

In other words – in a normal up trend one could place two parallel trend lines bounding the rising highs and lows and create a rising price channel. But aggressive selling into each rally sets up a series of weaker highs which causes the upper trend line to tilt down toward the lower trend line to create a wedge. Some famous bearish rising wedges were INTEL March – September 2000 and the US$ index October 2000 – January 2002

Here we see Tesla Motors Inc (TSLA) falling down out of a large rising wedge – not as big as the First Solar (FSLR) wedge but still a worry. 


Wednesday, December 10, 2014

They all loved Crescent Point Energy:


Many “experts” quoted on stockchase.com still love Crescent Point Energy Corp. (CPG) - over the past two months they ranked the stock to be a hold (4), a top pick (2), a buy (9) and only 2 don’t buys. So now at mid day at $22.43 CPG is down 10% and the yield has soared to 11%. One of the recent comments of an expert (a few weeks ago at $35) says “He is quite optimistic on the energy space in general, but you always need to be picking good quality companies. Forgetting about the dividend, he likes this company’s growth profile”. Just to refresh - last July the price peak was about $47 and at the time just about all of the experts loved Crescent Point with “buys” dominating the last July – August window.

So here is the root of the problem - when “experts” get on business media – most talk their book. In other words few ever disclose what they intend to buy – or intend to sell – they just disclose what they own. So when they all own and love Crescent Point – who is left to buy?

Wednesday, December 3, 2014

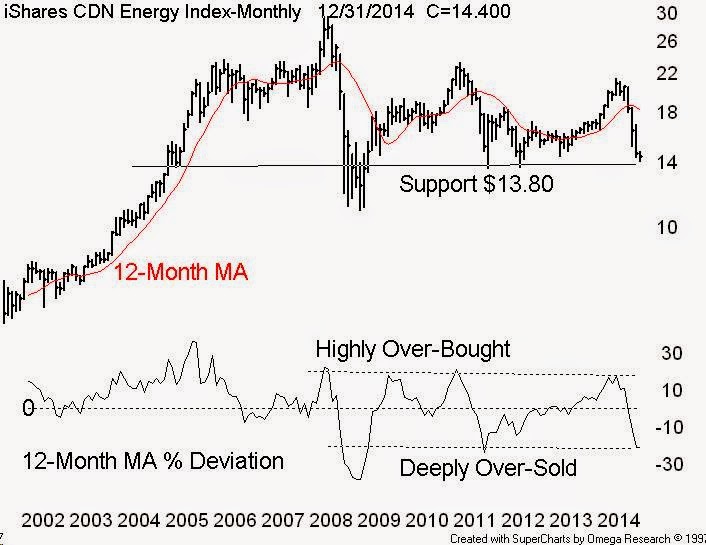
TSX Energy sector is technically over-sold:


Sometimes a bearish stampede out of a group of stocks can push prices down to an extreme distance below short and long term moving averages – such as the 50 and 200 day simple moving average (MA). I call this study a %D or percent deviation.

The Canadian energy complex as represented by the iShares S&P/TSX Capped Energy Index ETF (XEG) is deeply over-sold as measured by the per cent price drop from the long term mean as measured by the simple 200-day (or 40-week) moving average.

When studied on a monthly plot we get a bigger picture and I calculate the %D based on a 12-month simple MA. Note the lower plot on our long term monthly energy plot with the % Deviation line – now down to levels not seen since September 2011 and January 2009. It is reasonable to expect a recovery bounce at least back to the mean - the 12-month MA – currently $18.24 - over the next several weeks. The first upside price target should be at least back to the very short 50-day ma currently about $16.60.