Sometimes
a bearish stampede out of a group of stocks can push prices down to an extreme
distance below short and long term moving averages – such as the 50 and 200 day
simple moving average (MA). I call this study a %D or percent deviation.
The
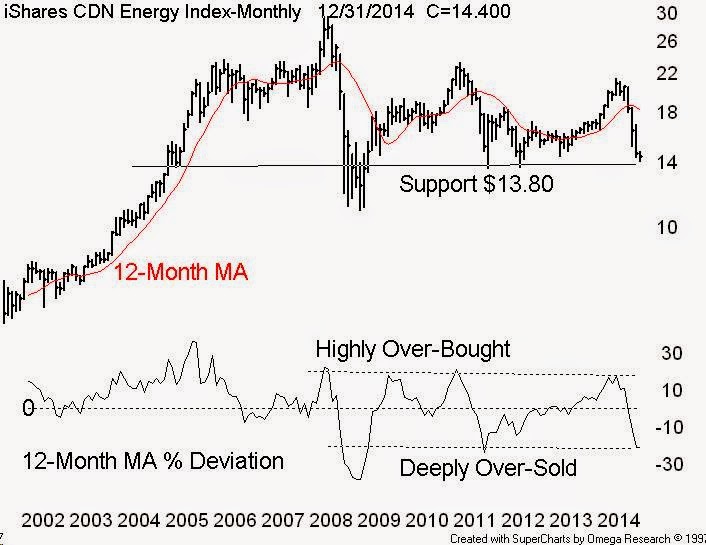
Canadian energy complex as represented by the iShares S&P/TSX Capped Energy
Index ETF (XEG) is deeply over-sold as measured by the per cent price drop from
the long term mean as measured by the simple 200-day (or 40-week) moving
average.
When
studied on a monthly plot we get a bigger picture and I calculate the %D based
on a 12-month simple MA. Note the lower plot on our long term monthly energy
plot with the % Deviation line – now down to levels not seen since September 2011
and January 2009. It is reasonable to expect a recovery bounce at least back to
the mean - the 12-month MA – currently $18.24 - over the next several weeks. The
first upside price target should be at least back to the very short 50-day ma currently
about $16.60.


No comments:
Post a Comment