Monday, November 30, 2015

Crude is displaying positive divergence:


Back on a blog post October 11, 2011 - I explained divergence to be a condition that occurs when two lines on a chart move in opposite directions vertically. A technician will traditionally look for divergence between a stock's direction relative to the direction of a technical study such as a price oscillator or the MACD.

Divergence can also be observed when doing inter-market studies such as gold vs. the gold stocks, a large cap index vs. a small cap index or price vs. volume. There are two kinds of divergences: positive and negative which can be also described as a bull or bear setup

Our chart today is the daily closes – last Friday - of crude (WTI) plotted above the daily closes of the US dollar index as replicated by the PowerShares ETF (UUP). The technical assumption here is that the two have an inverse relationship. So, when the UUP prints a new trading high at (B) relative to the old high at (A) - we expect the crude price to print a new low at (B) relative to the old low at (A). Clearly this did not occur – note the higher crude low at (B) which is a positive divergence condition creating a bull setup signal for WTI crude. Keep in mind this is a daily or short term signal and short term trend reversal studies can generate false signals.


Tuesday, November 24, 2015

Will that be guns or butter?


Below is a clip from the Getting Technical market letter - Interim Update November 20, 2015 GT1487

Economist Paul A.Samuelson is the founder of the modem introductory economics textbook. His textbook Economics – ISBN- 0-07-0 092863-0 has become a classic in which he states in a chapter – Central Problems Of Every Economic Society - that a nation has to choose between two options when spending its finite resources. It may buy either guns (invest in defence / military) or butter (invest in production of goods), or a combination of both.

According to Wikipedia - while president of the United States, Lyndon B. Johnson used the phrase to catch the attention of the national media while reporting on the state of national defence and the economy. Another use of the phrase was British prime minister, Margaret Thatcher's reference in a 1976 speech that, "The Soviets put guns over butter, but we put almost everything over guns.

World War II effectively ended the Great Depression of the 1930’s with the Dow Industrials rebounding from a 1942 low of 92.90 and then running up to a peak of 1000 in January 1966. The following ten years were cluttered with the noise of the Indochina War (Vietnam) and the Arab Oil Embargo.

When it relates to investing – there are two extreme possibilities:

The beneficiaries of guns over butter – Materials, Energy, Technology & Industrials

The beneficiaries of butter over guns – Financials, Consumer Discretionary & Consumer Staples & Health Care

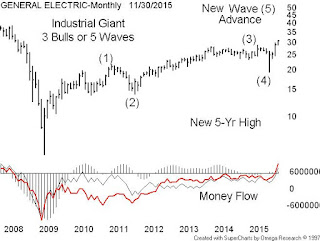
Our chart is of General Electric (GE) a component of the NYSE listed Industrial Select Sector SPDR Fund (XLI) which is a basket of large US industrial companies.


.

Thursday, November 12, 2015

Who is buying Barrick Gold?


As of 3 pm today November 12’ 2015, I note the shares of Barrick Gold Corporation (ABX) on the TSX trading at $10.00 – up 0.32 (3.40%) on good volume of 3,725,421 shares. The December gold contact was down slightly on the day.

Barrick has been a poor sector relative performer for years – unlike the stronger names like Franco-Nevada Corporation (FNV) and Agnico Eagle Mines Limited (AEM). Our daily chart of ABX–TSX displays unusual strength

Technical analysts should not react to a reversal pattern until complete – but Barrick seems to be building an inverse head & shoulder pattern since last July along with a big volume increase.
.
I have noted the left shoulder (LS) – the head (HD) and the incomplete right shoulder (RS). That tilted line is the neck line which – when extended to the right marks the price (currently $10.40) Barrick needs to break above on volume to complete the trend reversal. The fundamental reasons for the buying are not known to me but then again the price always leads the story.


Tuesday, November 3, 2015

Who is selling Constellation Software?


I was scanning several TSX sectors for outperform through year end and decided against the iShares S&P/TSX Capped Information Technology Index ETF (XIT) which seeks to replicate the performance of the S&P/TSX Capped Information Technology Index. When you look at the top 5 components by weight – you find CGI Group (GIB.A), Constellation Software (CSU), Open Text Corp (OTC), Blackberry Ltd (BB) and DH Corp (DH).

The technical problem is Constellation Software (CSU) – which closed at $550.87 today – down $15.61 (-2.76%) on 47,000 shares - it is a thin trader. Someone has been selling CSU for several weeks now – ever since the July 24 volume spike. Our daily chart of CSU suggests caution. We can see the double tops of July 29 and Sept 2 along with a flat to declining 50-day simple moving average.

The other negative issue is the declining money flow numbers. Those thin traders all have a common problem – you have to chase the offer on the way up and you have to chase the bid on the way down