Showing posts with label Buy Sell and Know When to Buy. Show all posts

Tuesday, July 12, 2011

Technical Non-Event

This is a clip from yesterday’s Globe Report on Business, “North American stocks suffered their deepest losses in more than a month Monday, as investors fled from risk amid deepening worries about the spread of European debt contagion, the U.S.'s own debt problems and the looming corporate earnings season.”

The S&P/TSX composite index closed down 191.95 points, or 1.4 per cent, the Dow Jones industrial average lost 151.44 points or 1.2 per cent and the Nasdaq composite index slumped 57.19 points or 2 per cent. It was a gloomy day.

The markets were been hoping the Greek crisis could be limited to Greece and a few other smaller Euro area nations such as Ireland and Portugal. But the sudden rise in concern about Italy raises the spectre of a much broader and harder-hitting debt crisis.
Pile on the uncertainty is the continuing impasses in Washington over the U.S. debt ceiling and the result is the fear of risky assets.

Now the problem technically is there is no problem. Our chart today is the Dow Industrials (daily) plotted above the Dow Transports (daily) along with the industry standard 50 and 200 day simple moving averages. Note in each plot the shorter 50 DMA is above the longer 200 DMA. Note also the price of the industrials and the transports is still above the 50 DMA. The nasty two day sell-off is a technical non-event so ignore those perma-bears who wish to scare you out of equities

Thursday, June 30, 2011

Cyclic Commonality

There are five cycle principles - Summation – Commonality – Variation – Nominality and Proportionality. Commonality is rare, much like a lunar eclipse. The condition is setup when the cycles of the major stock sectors bunch together following periods of congestion or non-correlated splaying. In other words when the peaks and troughs of cyclic rhythms and the relative magnitudes are similar when over-laid in graphic form - we have a significant buy or sell opportunity

The innovators of this graphic placement of the intermediate cycles were the great Ian Notley and Don Stark back in the early (1982) Dominion Securities Trend & Cycle days.

Our weekly chart is displaying a pending rare cycle commonality trough in the top five weighted TSX sectors – financial, energy, materials, industrials and energy. The summation of these troughs and peaks precedes a major move – this is only the second time in the last 5-years we have had a pending significant trough – this is a setup for a pending powerful advance through the summer months - possibly the most significant advance opportunity of 2011!

Sunday, June 19, 2011

NYSE A/D Line & Positive Divergence

A Google search on NYSE Advance Decline Line will serve up many offerings and so I selected http://stockcharts.com/school/doku.php?id=chart_school and this is a clip

“The Advance Decline Line (AD Line) is a breadth indicator based on Net Advances, which is the number of advancing stocks less the number of declining stocks. Net Advances is positive when advances exceed declines and negative when declines exceed advances. The AD Line is a cumulative measure of Net Advances. It rises when Net Advances is positive and falls when Net Advances is negative. Typically, the advance-decline statistics come from the NYSE or Nasdaq on a daily basis. Chartists can plot the AD Line for the index and compare it to the performance of the actual index. The AD Line should confirm an advance or a decline with similar movements. Bullish or bearish divergences in the AD Line signal a change in participation that could foreshadow a reversal.”

Note the key word here DIVERGENCES. A divergence occurs when two lines on a chart move in opposite directions vertically. The lines can be two indices (the DOW and the Russell2000) or, an index and a technical study such as a stochastic or for our purpose the NYSE advance/decline line. A positive divergence occurs when the indicator moves higher while the stock is declining. A negative divergence occurs when the indicator moves lower while the stock is rising.  
Our Current NYSE A/D line is displaying positive divergence due to the higher low relative to the prior March low. In other words the current low of the S&P500 is not confirmed by the bullish higher low of the A/D line.

Tuesday, June 14, 2011

The Intermediate Stock Cycle

An intermediate stock cycle trough will serve up the best entry an exit points for equities. Historically the intermediate cycle is measured in weeks and will have a bull or positive skew of about 12 weeks and a bear or negative skew of about 8 weeks. This gives us – on average – a trough to trough measurement of about 20 +/- weeks. In a bull market (like this one) the bull skew will be longer in duration than the bear skew and in a bear market (such as 2007 – 2008) the bear skew will be longer than the bull skew.

The last complete intermediate cycle peaked on May 7, 2010 and troughed 12-weeks latter on July 23, 2010.

The Japan earthquake of March 11 2011 has interrupted the current intermediate cycle correction in the commodity sensitive sectors - (metals & mining, materials and energy) that began in January 2011.  The "Japan Event" triggered a 6-week rally from March 18 to April 22 and has delayed our anticipated cycle low of early May 2011 until mid June 2011


Monday, May 30, 2011

No Investment Sheep in Sight

If I had to pick one commodity that is still out of favour with investors it would be natural gas. When I study a long term chart of natural gas (monthly) I see a bear market low in September 2009 followed by a large 20 month symmetrical triangle. This in turn has printed a series of higher lows and is about to generate a positive 10-month ROC number.

We need to get into the natural gas space before the investment sheep arrive. In this case the investment sheep will likely be those trend following portfolio managers who are currently chasing the utilities, consumer staples and telecom stocks. Now when the sheep take note that natural gas prices have stopped declining (three higher lows since last October 2010) they may begin to accumulate the shares of the natural gas producers.

Some smaller names would be Celtic Explorations Ltd., Trilogy Energy Corp, Birchcliff Energy Ltd, Paramount Resources, Fairborne Energy Ltd., Perpetual Energy Inc, Corridor Resources Inc., Tethys Petroleum Ltd., Delphi Energy Corp. and Vero Energy, Inc. The big go to name is EnCana Corporation (ECA). The long term (monthly) chart of ECA displays the monthly cycle troughs of 2003, 2008 and 2009. Note the pending trough of May 2011 that is about to signal the end of the short 10-month ECA bear. This pending cycle trough is supported by an improving relative reform signal. On a P & F chart ECA needs to break above $35 to trigger a bullish stampede into the name.

Sunday, May 15, 2011

A high Canadian Dollar = Cheap U.S. Stocks

When it comes to investing the average Canadian will typically be up to their necks in small-cap resource stocks. A glance at any TSX most-active list tells the story. Day after day, resource stocks dominate the most-actives. Last Tuesday there were only six non-commodities related stocks in the top thirty most-actives list. Contrast that to the new 52-week high list. Out of a population of twenty five new 52-week highs, only two were commodity related.

The reality is while the commodity stocks are actively traded, most have been treading water since early January. This is typical of an over-crowded space where the owners of gold, copper and energy stocks trade among themselves much like sport fans trading baseball cards. The lack of new money entering an over-crowded space will make the group vulnerable to any noise that could trigger panic selling. The “noise” that triggered the bearish stampede out of the commodity space was the CME Group announcing margin requirement increases for gold and silver futures

OK so now we had a correction in the commodity space and I wonder how many Canadian investors will buy more of this stuff and ignore the opportunities in the US markets? Our Dow vs. TSX60 chart displays a surprising reality – the big cap DOW has been out performing our big cap TSX60 for about a year and lately that over perform is accelerating. The NASDAQ Comp is even stronger – wake up and take advantage of our over-priced petro-dollar.

Friday, May 6, 2011

Crisis, What Crisis?

In February 2010 I became a technical sub-advisor to Stonebrooke Asset Management Ltd. who manages the Hybrid Investment Program under the Elite Wealth Strategies program for Union Securities Ltd. In other words Union have a program that uses the joint skills of a fundamental and technical analyst to manage their client portfolios. Our objective for the most part is to enjoy the returns of a bull market and to not enjoy the losses delivered in a bear market.

Of course every asset manager has the same sales pitch, holding themselves out to be different with some in-house “black box” that generates buy and sell signals.  

We simply remain for the most part fully invested with a view to control risk by shifting in and out of asset classes. For example the recent bearish stampede out of the commodity space is typical of too many investment sheep in the same space at the same time. The “noise” that triggered the stampede was the CME Group announcing a series of margin requirement increases for gold and silver futures.

Here are a couple questions I get on a daily basis:

Q) Anyone can generate positive returns is a bull market but what happens when you get a nasty correction triggered by some unforeseen event like the recent collapse in the price of gold, silver, copper and crude?

A) That was a sector crash – in a bull market the money will move from place to place and so the idea is to pick a group of sectors – arrive before the sheep and leave when the space gets over-crowed. The recent “crisis” was centered on the commodity space with the technology and health care sectors unaffected.

Q) What about new money? All well and good to get long in mid 2009 but what about now? Why not wait for the next crash?

A) There is always an excuse not to get invested. Who do you know who got invested in March 2009 when most were engaging in panic selling? If you wait for the next crash you may wait for years, since 1970 there have been only FOUR meaningful or material crashes or granddaddy bears 1973-1974, 1987, 2000-2002 and in 2007-2008.

So I hope that helps. Investing like life is not a spectator sport so get in the game.


Thursday, April 28, 2011

The Next Big Thing

The next big thing is a key “must know” for long term investors who wish to make above average market returns without excessive trading in and out of volatile stocks. The next big thing is a pending dominant theme that can persist for at least 10 years. The dominant theme will drive the beneficiaries upward to all time highs and for the most part will have long bull cycles interrupted by short flat bear cycles.

Some past dominant themes were the Nifty Fifty of the 1950’s and 1960’s. The mid to late 1970’s introduced the modern economy or first technology boom of the English speaking countries. The mid 1980’s introduced a parallel boom in the financial services sector – so for twenty years from 1980 to 2000 all you had to do was to own technology and bank stocks. Some past false booms were infrastructure and alternate energy.

Our chart is about 15-years of the technology weighted Nasdaq Composite that clearly displays the first technology bubble that was confined within the English speaking countries. The 2000 – 2010 period is a 3-cycle secular bear which is now almost completed. Yesterday the Nasdaq jumped to a 10-year high as U.S. stocks rallied on Wednesday after Fed Chairman Ben Bernanke's first-ever press conference. This is significant technically because a second “echo” or global technology is now just getting underway in the emerging markets. The Nasdaq is our new dominant theme.

Monday, April 25, 2011

Apple Inc. Who made the most money?

I can always spot a novice technical analyst when I look at a few of their charts. Some common errors are the use of incorrect scaling, the excessive use of squiggly lines, the excessive use of daily charts, the reliance on free internet charts from Big Charts or Stockcharts and the inability to spot divergence.

The scaling error is the easy error to spot so here is the rule: If the data in the window doubles use a semi-log scale. I do note the Market Technicians Association (MTA) recommend switching to a semi-log scale if the data exceeds 30% of the price range.

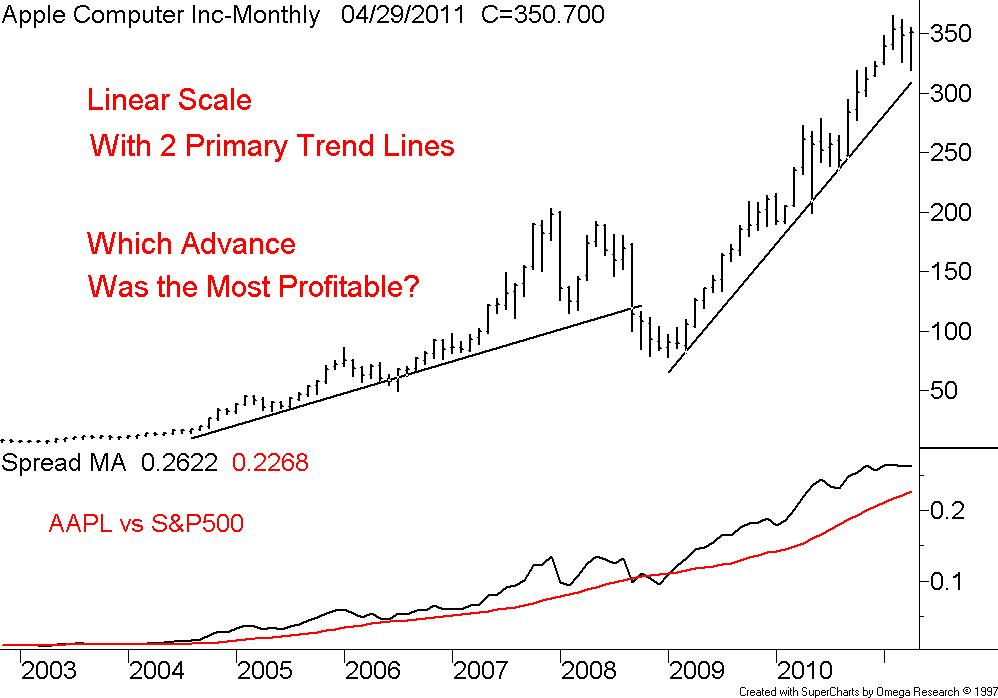
There are two big problems associated with the use of a linear scale in long term technical analysis. First is you cannot properly place trend lines on a linear scale chart and second, in a long advance it appears most of the gains are recent. In other words the newer investors are making more money that the older investors. This creates a false sense of urgency to jump in now because the advance appears youthful.

Note our first chart of Apple Inc., monthly data spanning about 10-years using a linear scale. I have placed two primary trend lines that split the two great advances of 2004 to 2008 and then from 2009 to date. So which advance made the most money?

Note our second chart of Apple Inc., monthly data spanning about 10-years using a semi-log or percent scale. I am now able to properly fit one primary trend line that still splits the two great advances of 2004 to 2008 and then from 2009 to date. So which advance made the most money?


Monday, April 18, 2011

The Advance Decline Line

According the Market Technicians Association - the Cumulative Daily Advance-Decline Line, perhaps the most widely known market breadth indicator, traditionally has been used to spot divergences relative to a general market price index, such as the S&P 500 or Dow Jones Industrial Average. Most commonly, the Cumulative A-D Line is calculated as a running total of daily net advancing minus declining stock issues on the New York Stock Exchange. Similar indicators may be calculated for other markets, such as NASDAQ, and weekly data also may be used. There are only two steps to compute this indicator.
1. From the number of advancing issues, subtract to number of declining issues each day, respecting sign. This is net advancing issues, and it is often a negative number.

2. Add that daily advance-declines difference to a cumulative total of the daily net advancing issues. This forms a continuous line that rises and falls with breadth trends on the NYSE.

The late great Ian Notley used a slightly improved formula which takes into account the number of unchanged issues or (advancing –declining)/unchanged. Either way the best way to read the A/D line is to spot divergences – such as the current divergence between the S&P500 and the NYSE A/D line. In order to correct the current negative divergence condition we need both the S&P500 and the A/D line to push back above their February – March peaks as noted on the chart. We should respect this indicator as it called the March 2009 bottom and the July 2010 bottom

Tuesday, April 12, 2011

The Rebound Bull

For those who missed my April 1, 2011 BNN rant describing the structure of the current global bull market in equities to be that of a rebound bull.

“A rebound bull is a bull market of short duration and great magnitude that typically follows a granddaddy bear market. The granddaddy bear is introduced by a crisis and is usually of long duration and great downside magnitude. There is no defense against the Granddaddy bear because like a financial tsunami, all stock asset classes swept away at the same time. There have only been three granddaddy bears over the past 40 years – the 1973-1974 Arab Oil embargo. The 1987 change in U.S. Fed policy bear and the 2007-2008 liquidity crisis. The bear of 2000-2002 was not a granddaddy but rather a sector crash (technology) with other sectors – financial and energy being unaffected.

The rebound bulls that followed each of the granddaddy bears were all similar in that they were short – no more that 24 months and they had great price magnitude, usually in the order of at least a two thirds retracement of the granddaddy bear. Rebound bulls are usually followed by a flat cooling off period – like a flat mini-bear if you will and when the cooling period ends the markets move on to new 52-week highs.

The best way to deal with the current mature rebound bull is to seek out stock sectors like the TSX Financial that are just emerging from the “cooling off” period.”

Note: The only other sector with similar structure is TSX Technology

Tuesday, April 5, 2011

Gold Bugs and Gold

In a previous post I detailed the very long term relationship between the gold miners and the price of bullion which has not been one of perfect price correlation. During the early stages of gold’s secular advance (2000 through 2003) the gold miners outperformed the price of bullion. In the mid stages of the secular advance (2004 through 2008) the price of bullion outperformed the gold miners. This relationship was displayed on a very long term monthly chart

As we enter the mature stages of gold’s secular advance and there is growing technical evidence via shorter term spreads that the gold miners will once again return to out perform. This is displayed in more detail on a weekly chart where I have placed a relative average spread along with the weekly stock cycle. Note the bullish cyclic commonality of the intermediate cycle troughs in the stocks and the metal.

It appears a bullish stampede into the gold miners is just getting underway which is typical of a late cycle blow off. Enjoy the party but don’t over stay your welcome.

Thursday, March 31, 2011

Gold and the Gold Stocks

The very long term relationship between the gold miners and the price of bullion has not been one of perfect price correlation. This is because the producers unlike bullion have “issues” such as exploration risk, political risk, environmental risk and cost risk. However the producers under the right conditions can be a leveraged way to trade in and out of the precious metals complex.

During the early stages of gold’s secular advance (2000 through 2003) the gold miners outperformed the price of bullion. In the mid stages of the secular advance (2004 through 2008) the price of bullion outperformed the gold miners. Now we seem to be getting into the mature stages of gold’s secular advance and there is growing technical evidence via shorter term spreads that the gold miners will once again return to out perform

Thursday, March 24, 2011

Action and Reaction

The Japan event of March 11, 2011 is probably going to be stimulative. Japan unlike Haiti is a large modern economy and the re-build will be a priority for the Japanese people. We know that Japan will need a lot of “stuff” – commodities, machinery, and infrastructure along with complicated transportation needs.

Technical analysts tend to believe that for every negative event there is a positive event somewhere else – sort of like Newton’s laws of motion – one being action and reaction. The negative Japan event should boost the price of coal, copper, wood and natural gas. Now the one big commodity laggard over the past several years has been the price of lumber – likely due to the depressed U.S. housing starts. We need to watch lumber closely. Note the weekly chart displaying lumber’s intermediate cycle along with a very slow %K and %R stochastic. Note the current down cycle and the bullish flat price, a sign that the intermediate cycle will turn up above the zero line. If we break above that 5-year level we need to buy the beneficiaries – action and reaction

Tuesday, March 22, 2011

Who are They?

Apparently they are taking the shares of Canadian Pacific Railway (CP.TO) down about 3% to-day because CP earlier warned that its earnings will be down in the first quarter as harsh winter weather hampered train operations and fuel recovery surcharges lagged. Sometimes “they” are simply the market or “they” could be guys like Gordon Gekko. They have been moving the markets for years and I still don’t know who in hell “they” are.

In the case of CP it appears that “they” (Gordon Gekko) knew something was up with to-day’s poor earnings surprise when back in mid February “they” began to sell CP and buy CNR. Take a look at our CNR vs. CP ratio chart where the price divergence is obvious. Not to worry – I am sure the OSC is all over this and protecting us little guys


Sunday, March 20, 2011

Black Swan Hype (2)

Our Japan “Black Swan” is now just over a week old and so I wonder how investors reacted to the volatility of last week. Several industry “experts” went public with profound statements. For example one money manager in a memo to a securities firm, “if you’re your not invested buy now”, and (the same guy) “if currently invested sell now.”

Personally I would rather listen to the markets rather than a black swan which is a large not too bright water bird found mainly in the southeast and southwest regions of Australia. It seems the best stocks were the ones that were strong before the Japan event and remained strong after the event. Some examples are forest stocks, energy stocks and the financial stocks.

I am currently over weight the CDN bank stocks and using the BMO Equal Weight CDN Bank ETF (ZEB) - not a bad yield 3.7%, pays monthly with opportunity for capital gain.

Thursday, March 17, 2011

Black Swan Hype

I don’t know about you but I grow weary of being regarded as stupid by these “Black Swan” guys who use scare tactics to influence normally sane investors.

A Black Swan is the latest buzz word which is a metaphor that encapsulates the event to be a surprise with major impact. In the “old” days we used the term “exogenous event”. An exogenous event in the capital markets is a one-off variable that is not resultant from any of the usual market drivers such as earning releases, employment data and industrial production numbers. The exogenous event (in this case Japan) is an external event that is large enough to affect markets and because it is change that comes from outside any model or analysis, there is no way to anticipate the event

The black swan buffoons tell us “this time it’s different, something is wrong.” The idea here is to have you believe that what ever worked in the past, won’t work anymore. We are to reject traditional stock analysis and to fear the current environment because it always the wrong time to invest.

They will tell you that buy-and-hold is dead because the equity markets have delivered zero returns over the past twelve years, just like the 1968 – 1980 period. What they don’t tell you is that during these long congestive periods there is great opportunity because “the next big thing” can emerge from these periods. The next big thing that emerged from the 1968 – 1980 zero return period was the new economy and the related components. To-day start-ups like Intel Corporation, Cisco Systems, Inc. Microsoft Corporation and Apple Inc. are household names.

The current 2000 – 2011 zero return period introduced the global economy and the related commodity boom. I do believe the Black Swans which is a large waterbird found mainly in the southeast and southwest regions of Australia missed this great investment opportunity.

Monday, March 14, 2011

An exogenous event

According to a blog post at The Traders' Trader, Bill Cara, (I don’t know this guy) at: www.CaraCommunity.com “random noise was the helter-skelter spin of all the Talking Heads on Financial Entertainment TV leading up to and in post mortem discussions re the FOMC announcement. My point on this is consistent: turn the TV off. (and) If there are 5, 10, 100, or 1,000 Talking Heads, or whatever number of clowns make it onto the stage, you are not going to learn anything. These people are not there to make you money; they are simply walking billboards for financial services industry companies like Ameritrade, PIMCO, Merrill Lynch, or whatever. The more they talk, pointing you in different directions, the greater is the random noise.” (and) “An exogenous event in capital markets is a one-off variable that is not resultant from any of the usual market drivers. It is, however, an external event that is large enough to affect markets.”

OK – I’m back. The Japan earthquake was an exogenous event that was unforeseen and will interfere with normal junctures and trends in the capital markets. In other words there will be capital winners and losers as a result of the massive re-build. As investors we must avoid the losers and make sure some of the beneficiaries are in our portfolio. The obvious sector winner is the lumber exporters such as Weyerhaeuser and Int’l Forest Products – just to name a few. Out chart displays a surprising pattern – both of these names were in up trends before the Japan crisis. Strange that in the midst of a crisis the stocks that were advancing before – continue to advance and the stocks that were declining before, continue to decline. When you look back at the 911 crisis the same thing happened with up and down trends uninterrupted. The fundamental guys will never get it – the trend is your friend

Thursday, March 10, 2011

Negative Divergence

Divergence is a situation that occurs when two lines on a chart move in opposite directions vertically. Divergence can be comparing a stock's direction to the direction of its RSI, its MACD or a momentum oscillator. Divergence can also occur between two related asset classes such as the price of gold and the price of a gold stock. There are two kinds of divergences: positive and negative. Positive divergence occurs in a down trend when one line moves higher while the other is still declining. Negative divergence occurs in a uptrend when one line moves higher lower while the other is still rising.

Note our Dow Industrials vs. Dow Transports chart with the Industrials are just at or above the January peak – now note the Transports are well below the January peak setting up a negative divergence condition. This could be the early setup for a Dow Theory sell signal and keep in mind that while rebound bulls are short they are never followed by severe crashes – but rather a short trendless bear – a stock picker’s market 

Wednesday, March 2, 2011

The A-B-C Correction (2)

Five weeks ago here I suspected the Dow Transports was at the beginning of a normal Elliott Wave A-B-C correction that typically follows an impulse wave.
The correction will usually begin above the 50-day moving average with the A wave down breaking under the 50-day and stopping at support at above the 200 day MA. The subsequent recovery B wave fails to make a new high (swing failure) and the following down C wave breaks under support at the 200 day MA and the selling can get nasty. Sometimes the recovery wave B will exceed the beginning of wave A – see our Dow Transport daily chart.

According to Elliott Wave International, In a regular flat correction, wave B terminates about at the level of the beginning of wave A, and wave C terminates a slight bit past the end of wave A, as we have shown in Figures 14 and 15. Far more common, however, is the variety called an expanded flat, which contains a price extreme beyond that of the preceding impulse wave. In expanded flats, wave B of the 3-3-5 pattern terminates beyond the starting level of wave A, and wave C ends more substantially beyond the ending level of wave A, as shown in Figures 16 and 17.