Tuesday, June 10, 2014

Gold Stock performance is relative


In a Getting Technical market letter - Interim Update December 18, 2013 GT1419 – I selected two gold stocks to be held for recovery through 2014. They were B2Gold Corp (BTO) with a price at Dec 17, 2013 of $2.19 and Osisko Mining Corporation (OSK) with a price at Dec 17, 2013 of $4.65

I displayed a weekly chart of Osisko Mining Corporation (OSK) that was displaying several bullish technical signals – a bullish (youthful) weekly cycle and the important recent higher (October) lows relative to the prior lows of mid 2013. A higher low in a down trend is important – on a weekly chart – because a higher low could be a signal of a positive trend change. In other words the brutal end of December tax loss selling had not sent these names down to new lows.

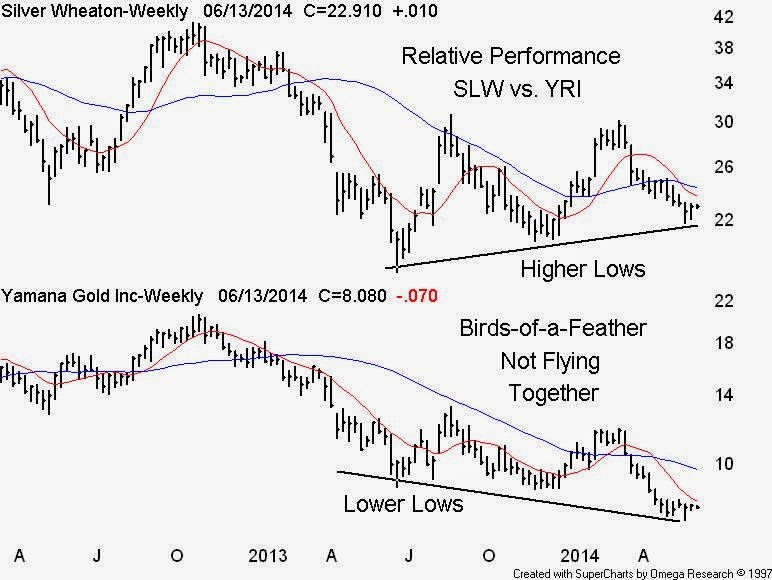
We can apply the same relative argument today against the gold and silver miners because although they are birds-of-a-feather many do not fly together as displayed in our Silver Wheaton vs. Yamana Gold chart – go with the higher lows. Other lower-low names are Alamos, IAM Gold, Kinross and SilverCorp


Sunday, June 8, 2014

Is your advisor just a Salesman?


I grow weary of the business media and investor advocates referring to investment advisors as “salesmen”, as if that is a bad thing. Last week a piece on bad investment advisors appeared in the Globe and Mail – Report on Business “How can investors protect themselves from financial fraud? John Heinzl - INVESTMENT REPORTER The Globe and Mail Published Friday, Jun. 06 2014, 5:21 PM EDT - the in-print heading was “Ensure your advisor is not just a salesman.” Heinzl features Stan Buell who “knows what it’s like to be the victim of a crooked financial professional.”, because – “Years ago, he lost about $1-million to a broker who made unauthorized trades on his account and engaged in fraud.”

This was a follow up from “A victim speaks out about financial fraud” - John Heinzl - The Globe and Mail Published Friday, May. 30 2014, 7:39 PM EDT. Heinzl admits hearing from an investment adviser who said the column was “inflammatory” and depicted the industry unfairly, and from a portfolio manager who prides himself on “trust” and “integrity” and said he hoped (Heinzl) would write a column that “highlights the value of a good adviser/client relationship.

My beef is the insult to salespeople because I believe that in our system, – “Nothing happens until someone sells something to someone else.” The reality is that all successful corporations and individuals rely on sales skills to survive and grow. Are not the major banks, auto manufactures, drug companies, retail chains, hotels and food chains primarily sales & marketing organizations? Do not employees “sell” their skills to their employers? Is not John Heinzl basically a salesman who markets his column?

According to journalist Gavin Adamson – the victim, Sten Buell works for Royal LePage and according to FAIR Canada in 1990 Buell left engineering to join his wife in real estate sales and became an associate broker with Royal Lepage – in other words – a salesman.

Is Stan Buell the victim of a crooked financial professional? If true, I would ask the Heinzl / Buell team to please be transparent – and publish the dates, the offence, the names of the advisor / advisors and the name of the firm involved in the Buell fraud – that is called investigative journalism.
Monday, June 2, 2014

Long Term Apple Charting:


If I had to produce a technical analysis exam – I would only ask one question: When looking at a bar chart what scale do you use? Pick one.

1- Linear Scale Always
2- Semi log Scale Always
3- It don’t matter
4- Up Trends use Linear Scale – and - Down Trends use Semi Log Scale
5- Up Trends use Semi Log Scale – and - Down Trends use Linear Scale

I and many other experienced technical analysts will always go with #2 Semi Log Scale Always. If you are a business media reporter you may choose #1 so as not to confuse your reader / viewers,If you are selling mutual funds you may chose #4 because the up-trends look bigger than the down-trends and If you are an investor advocate you may chose #5 because the up-trends look smaller than the down-trends

If you pick #3 you are likely to be an accountant or, a financial planner

This is a repeat of an Apple Inc item on chart scale selection I did 2-yers ago – only the charts have been up-dated:

“Much has been said about the recent advance in the shares of Apple Inc. with the big focus on the February to March non-stop run from $400 to $600. Now with Apple paying a dividend there are views on a transition of Apple from a growth company into a value cash cow that will spin of cash to the shareholders, A few days ago on business TV a technical analyst referred to the recent advance to be “parabolic” and warned of a probable nasty correction – see chart below.”


And:

“The technical analyst made a common error – typical in the industry in that he is using the incorrect scale. The rule is if the price data in the window doubles – use a semi log scale. Linear scales are OK for TV and newspapers but not OK for proper trend analysis.
Our second Apple chart below clearly displays Apple in a defined secular advance within the center of a long term growth channel. The so-called parabolic run has vanished.”