Thursday, October 24, 2013

Successful Investing vs. Urban Myths


Market timing is a failed strategy – if you wish to add alpha - seek out the current dominant theme: The dominant theme is a period of rapid expansion of an industry group due to innovation or in reaction to changing economic conditions. Investors and portfolio managers who can correctly identify and ride the dominant theme will likely generate several quarters of above market returns.

The first modern dominant theme was the new economy technology boom of the 1980’s and 1990’s that followed the 1973 Arab Oil Embargo. We had the introduction of the PC and the Internet thanks to the humble beginnings of Cisco Systems Inc., Intel Corporation and Microsoft Corporation. Dumb automobiles became smart thanks to fuel injection and computers.

The second modern dominant theme was new millennium emergence of the global economy and the resulting commodity price boom that ended abruptly with the global financial crisis bust of 2007 – 2008. The subsequent recovery from early 2009 has exposed several new dominant themes.

We have had the U.S. housing recovery and the subsequent rebound of the housing and lumber stocks. We have a boom in the aerospace & transport sector driven by a mix of high energy costs and a travel / consumer boom which has the major airlines up grading their fleets along with municipalities up grading their transit networks.

I will address these issues plus a new theme at the Toronto World Money Show. To register follow this link: http://www.moneyshow.com/tradeshow/toronto/world_moneyshow/?scode=033174


Wednesday, October 23, 2013

The NYSE A/D Line Refresher:


According to Stockcharts.com – the Advance / Decline Line (AD line) is one of the most widely used indicators to measure the breadth of a stock market advance or decline. The AD line tracks the net difference between advancing and declining issues. It is usually compared to a market average where divergence from that average would be an early indication of a possible trend reversal

They say a picture is worth a thousand words so I will let my chart do the taking. The upper plot is the S&P500 and the lower plot is the NYSE A/D line which is just now breaking up and out of a large ascending triangle to confirm the new highs on the S&P500. Ignore the doom and gloom crowd for now.


Saturday, October 19, 2013

Sector Rotation Refresher:


A clip from Getting Technical letter - Interim Update October 7, 2013 GT1413 a refresher on using natural stock sector rotation: The various stock sectors advance and decline in reaction to the expansion and contraction of the business cycle. Typically the “front end” of the market – the Financial, Telecommunications Services and Utilities begin to rise in anticipation of improving business conditions and a low interest rate environment. This stimulates the “middle” of the market and the Technology and Industrial stock sectors begin to rise in anticipation of improved corporate spending. The growing demand for goods stimulates the need for raw materials and the “back end” of the market – Materials, Mining and Energy, begin to advance

As the economy expands, inflation fears trigger higher interest rates and the “front end” of the market peaks in anticipation of a slowdown in consumer spending. As the slowdown becomes evident the “middle” sectors peak as industrial demand slows eventually dragging down the lagging commodity sensitive “back end” stock sectors.

Sector                                     #         
Financials                                Leading - Interest rate sensitive
Telecommunications Service Leading - Economy sensitive
Utilities                                     Leading - Interest rate sensitive
Consumer Discretionary        Coincident - Economy sensitive
Consumer Staples                  Coincident - Defensive
Health Care                             Coincident - Defensive
Information Technology          Coincident - Economy sensitive
Industrials                                Coincident - Economy sensitive
Energy                                     Lagging - Commodity sensitive
Materials                                  Lagging - Commodity sensitive

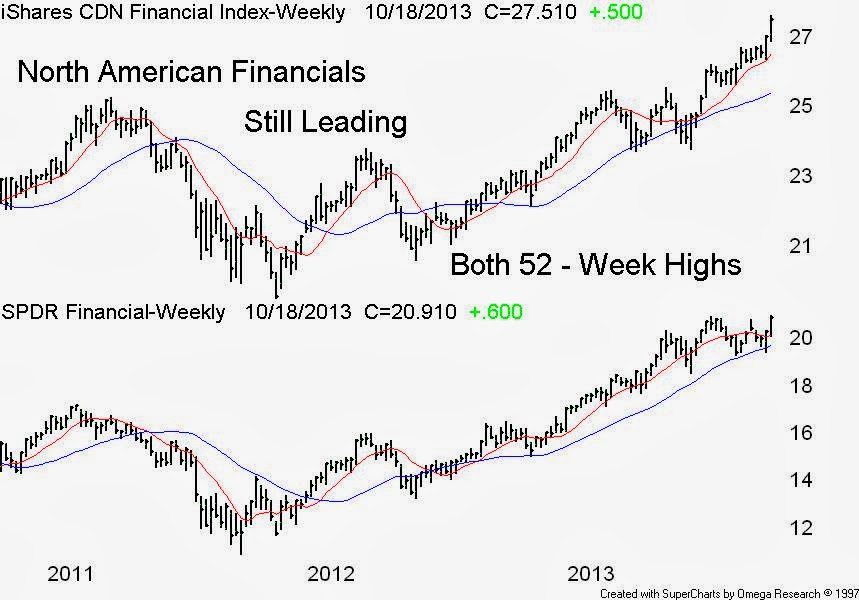
So here is the problem for the bears – The North American Financials are still leading having posted as a group - new 52 week highs at the close on Friday October 18, 2013. By the way – the last time the SPDR XLF peaked was in May 2007, 5 months ahead of the S&P500 peak of October 2007.