Tuesday, October 28, 2014

North American Technology – stealth leadership:


We at Getting Technical use the long term (monthly data) and intermediate term (weekly data) sector momentum tables to track the rotation of various stock sectors. Often a sector will display strength on the monthly tables and conversely display weakness on the weekly tables - a condition that can mute the longer term trend. The ideal condition is for a sector to display strength – or a high rank on both the monthly and weekly tables. Currently the technology sector is printing a high rank in both the weekly and monthly Canadian and U.S. sector momentum tables.

In Canada the go-to proxy for the technology sector is the iShares S&P/TSX Capped Information Technology Index ETF (XIT) which replicates the performance of the S&P/TSX Capped Information Technology Index, net of expenses. The index is comprised of constituents of the S&P/TSX Composite Index in GICS Sector 45 – and the constituents are capped at a 25% weight.    

The top five holdings by weight are: CGI Group Inc (GIB/A) 24.64%, Open Text Corporation (OTC) 19.78%, Blackberry Ltd (BB) 15.04%, Constellation Software Inc (CSU) 15.00% and DH Corp (DH) 7.21% to total almost 82% of the sector by weight. A technical study on one component – Blackberry (TSX-BB) suggests the downside may be limited based on long term monthly data – and the two large triangles – the bearish descending triangle of 2008 – 2011 and the current possible reversal symmetrical triangle. Note the money flow numbers suggest exhaustion on the buy and the sell side.


Wednesday, October 22, 2014

At the Toronto World MoneyShow:


I presented at the Toronto World MoneyShow on October 18, 2014 and explained how I used technical analysis to select at least 5 takeover candidates during my time as a sub-advisor to the Union Securities Hybrid program. For a copy just post a blog comment or contact me at info@gettingtechnical.com

I took questions on the fly and several centered on my views of the recent global sell-off in the equity markets – I was prepared and proceeded to display several crisis-related graphic – front page - headlines displayed by the financial press.

The first was a cartoon of and upside down bull (Barron’ s October 19, 1987. The second was a list of “Canada’s hottest dot-coms” (Globe Report on Business June 22, 2000. The third was a cartoon of several great US financial giants being swallowed by a giant black hole, “A Day Of Reckoning” (Globe Report on Business September 16, 2008). The fourth was a full page one-day dive of the Dow Industrials, “Worst one-day fall etc.” (Globe Report on Business August 5, 2011 and finally a full page graph of the TSX Comp and the TSX Energy sector crashing, “FORTY-DAY FREEFALL”, (Globe Report on Business October 15, 2014). In each example these huge banners were published very near to important troughs or peaks, - a great contrarian indicator.

At least the Globe is creative, a Toronto Star item - Monday, October 20, 2014 just rehashed an old correction classic “Why this market correction is no cause for panic:” The author advises the readers to, “turn off the TV. Ignore the noise” and that “the best companies pay dividends“- advice from an author with no financial accreditation.

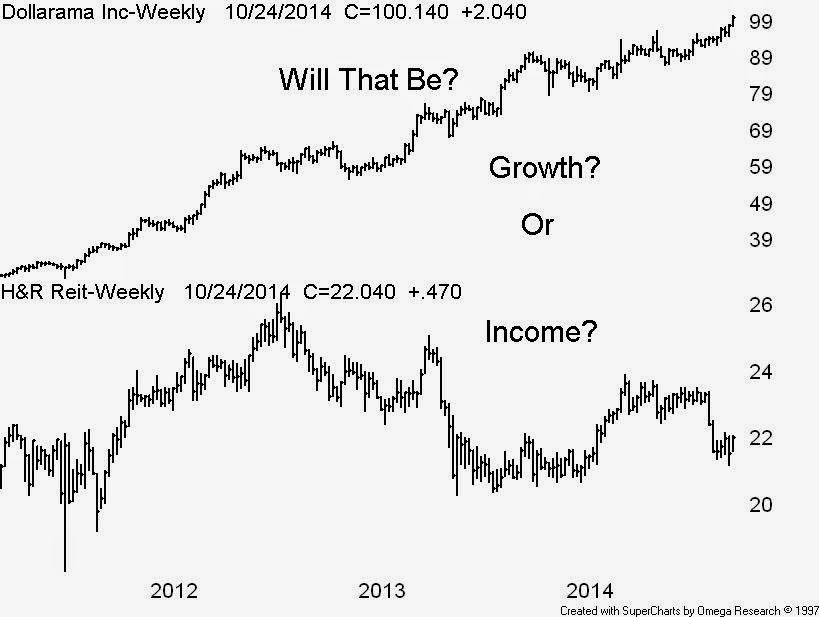
Well, some of the “best companies” had big declines from their recent 2014 price peaks, Bank of Nova Scotia -15%, BCE Inc -10%, CDN Natural Resource -29%, CNR -16%, Enbridge -18% and TransCanada – 22% - I could go on. The chart today displays a low yield growth company plotted above a big dividend payer – and how about those dividend paying Dow components - Coca-Cola Co. (KO), McDonald’s Corp (MCD) and the late great IBM – all big dividend payers and share buy-back losers


Friday, October 17, 2014

Some bullish signals from the US financials:


I have learned that (thanks to the great Ian Notley) – no bull market can operate without the leadership – or participation from the financial sector of stocks. This rule would apply to most of the mature global equity markets.

Now according to Sector SPDRs the SPDR Select Sector Financial (XLF) is a wide array of diversified financial service firms are featured in this sector with business lines ranging from investment management to commercial and investment banking. Among the companies included in the Index are JPMorgan Chase, Wells Fargo, and BankAmerica Corp. Currently the top weight is Berkshire Hathaway B (BRK.b) at 9.0% followed by the usual suspect banks and then Goldman Sachs Group Inc, (GS) at 2.6%.

Note the chart displaying Berkshire – weekly above Goldman – weekly plotted with their respective 10  & 40 week simple moving averages – clearly both still trading above a rising 40 week (or 200 day M/A) – so there is no break in these bellwethers. By the way both lead us out of the 2008 financial crisis with the Berkshire bottom in Feb 20, 2009 and the Goldman bottom in November 21, 2008