Sunday, March 28, 2010

Rob Carrick Loves Active ETFs

Rob Carrick is truly a writing machine. Week after week this guy manages to fill two thirds of a page of the Saturday Globe’s Report on Business with “interesting” observations investment products, investment strategies and educational timbits. Personally I don’t read Carrick because aside from the space hogging fancy artwork and data tables I find the content repetitions and shallow. The bottom line is I never could apply Carrick’s material to make an dollar in the markets but I guess his job is to play it safe and keep his employer out of trouble

His latest piece - last updated on Saturday, Mar. 27, 2010 “Almost all the things you don't like about mutual funds have been fixed in a new investing product called the actively managed exchange-traded fund.” I was curious to see his logic to support his profound “mutual funds have been fixed” claim.

Carrick leads with – “But now there's a different type of ETF – one that does exactly what conventional mutual funds do, but without the high cost and impediments to convenient buying and selling.

Question: Don’t all ETFs avoid the high cost and impediments to convenient buying and selling?

Carrick: - “Actively managed ETFs were introduced in Canada by Horizons AlphaPro in early 2009 and the reception was unenthusiastic. I wrote a column dissing them on the basis that many fund managers can't beat their benchmark indexes, a point that highlights the benefit of the traditional index-tracking ETF.

Question: So how come 12-months latter we now decide managers can beat their benchmark indexes?

Carrick: - “The actively managed ETF market has evolved in 2010, and so has my view. With some quality managers being recruited to run these ETFs, I think they have the potential to be one of the most significant retail investing developments in years.

Question: Aren’t these managers being recruited from the same fund industry that “needed to be fixed?”

Carrick: - “Subpar managers are easy to find in the mutual fund world – that's precisely why conventional index-tracking ETFs have become such a fast-growing product. But savvy investors know there are some managers who are worth putting to work in your portfolio. Actively managed ETFs are a smarter way to access these managers.

Question: If an active mutual fund manager is so good, why then work for less for an ETF manufacturer?

Carrick: - “Let's start with fees. The management expense ratios for five of the AlphaPro active ETFs is 1 per cent, while two others come in around 1.25 per cent. In addition, performance fees are charged if the funds beat specific benchmarks.

Question: How come Carrick fails to explain the 20% performance fee?

Carrick: - “A major reason why active ETFs cost less to own than mutual funds is that their fees do not include a component that is intended to compensate investment advisers for the counsel they provide clients. This so-called trailing commission accounts for one percentage point of the typical equity fund's MER and 0.5 points for the average bond fund.

Question: Is not a 1% trailer less than a 20% performance fee?

Carrick: - “Imagine you want to sell a fund with the market soaring at midday. You can do that with an actively managed ETF, whereas a fund exposes you to the risk that the market will pull back or even decline later in the day. When buying, you can take advantage of a dip to place your order.

Question: If the ETF is managed by a “quality manager”, how come we are now trading during “soaring at midday” and taking advantage of a dip to place your order? Are we not just to buy-and-hold and let the “quality manager” make those decisions?

Carrick: – “Because active ETFs are traded like stocks, you can use a limit order to set a ceiling on what you'll pay and a floor on what you'll accept when selling. You can also use a stop-loss order to liquidate your holding if the price falls through a certain threshold.”

Question: Are you suggesting we place restrictions such as ceilings and floors and stop losses on a “quality manager”?

Carrick: - “Here's a list of TSX-listed ETFs that use a manager to pick securities rather than following the traditional ETF strategy of tracking an index. All are part of the Horizons AlphaPro family.”

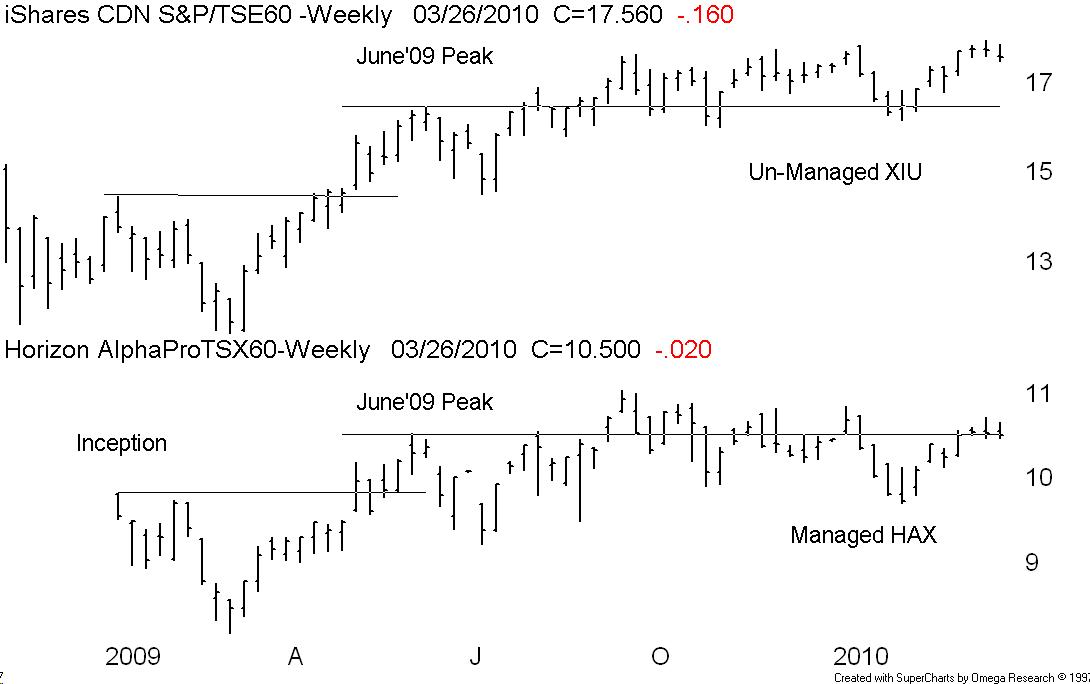
Question: If you can produce a list how come you don’t produce a track record?
By the way - Don Vialoux, Brooke Thackray, Dennis Gartman, Frank Mersch, Prakash Hariharan, Steve Rogers¸ Lyle Stein and Vito Maida are all sub-advisors to these products and not the fund managers as set out in the Carrick tables.

Tuesday, March 23, 2010

The 40-Week Moving Average Rule

This is a clip from a piece I wrote for the Canadian Securities Institute way back in April 2006
--------------------------------------

The 40-Week Rule:

The 40-week moving average (MA) is an industry standard for identifying trends. Keep in mid the 40-week on a weekly chart is the same as the 200-day on a daily chart. The rule is quite simple, if the PRICE is above the MA and the MA is pointed UPWARD, the trend is up. The trend is down if the PRICE is below the MA and the MA is pointed DOWNWARD.

I will also use the 40-week or 200-day MA to gage volatility and support levels.

Up trends and down trends in stocks can persist from several weeks to several years. A stock in an uptrend such as Dow component Boeing Co. will advance upward above its 40 week MA in a zigzag motion caused when it runs upward from the MA corrects down to the MA and then repeats the pattern over and over until the up trend comes to an end. Investors who are long the stock may reduce when the stock is “too far” above the MA and subsequently re-acquire the stock when it returns to support at the MA. New investors should never buy a stock when it is “too far” from the MA but rather enter when the stock returns to the MA. The problem is to define what “too far” is in terms on per cent.

What we are actually doing here is measuring volatility. I have found that volatility is normally higher in the micro-cap technology and resource stocks that typically trade under $5. It is not unusual for a copper or gold exploration company to trade up to 100% to 150% above the 40-week MA before a corrective period sets in.

A mid-cap industrial will rarely run above 50% above the 40-week MA and the larger caps will rarely run 20% above the 40 week MA and stock indices usually max out at the 10% level above the MA
------------------------------------------------------

To-day we will look for any stock that “returns to support at the MA” and fails to rebound by breaking down under the 40-week MA and possibly setting up a new down trend. A filter run last night at the close of March 22, 2010 selected over 25 issuers over the price of $3 that have just traded under their 40-week or 200-day MAs. To my surprise the list was populated by gold stocks. In other words we have a birds-of-a-feather sector failure. One example is Goldcorp a stock that is owned and loved by the BNN “experts” as set out on http://www.stockchase.com/Company-sl--slq-ID-slv-Goldcorp--Inc.php

One wonders if they all own and love Goldcorp, who is left to buy?

Sunday, March 14, 2010

Let us talk some more Bull

In a previous posting I noted there is no precise definition of a bull market and so I reasoned that if we could identify a bear market we could resolve the bull market argument. This logic is based on the fact the we can’t have a bull and a bear market operating at the same time. I then defined a bear market to be a major index as measured by the S&P500 or the S&P/TSX60 that posts a new 52-week low within a 26 week window. Our last new 52-week low was posted over a year ago and so with the bear gone, welcome to the 2009 – 2010 bull!

Unfortunately the investors out there who are enjoying the current bull still have to endure the endless stream of doom-and-gloom dribble that is served up by the financial media. Last week I scanned a Globe and Mail item Thursday, Mar. 11 entitled “The bear: Dead or just sleeping?” The contributors were the usual bears who have so far missed the 2009-2010 bull and in desperation try to talk the markets down so they can get on board. Are we are to believe this is a bear market sent temporarily into hibernation because the market “has glossed over the harsh realities that face the markets”? The “harsh realities” are credit bubbles, rising interest rates and possible threat of a double-dip recession that could utterly derail the market recovery.

Ok here is a “harsh reality”, firstly bear markets do not fall asleep or hibernate and the markets always lead the current reality. For example the current reality is a news item “Canadian bank profits top $5B” Tuesday, March 9, 2010 CBC News Total profits for Canada's six biggest banks surged to $5.3 billion in the first quarter as loan losses fell and their domestic operations flourished. Those profits are about 75 per cent higher than they were in the first quarter last year when the world financial meltdown was in full swing. The harsh reality is the bank stocks bottomed a year ago in spite of the “harsh reality” at the time which was a pending total collapse of to-days modern financial system. The markets as usual got it right.

The best way for investors to handle any bull market is to work with the three phases of the bull. The first phase is the non-belief period when the first advance is thought to be a bear market rally. At this time you can buy anything – just throw a dart and get invested. The second phase is the logical period, a period of rising prices along with improving fundamentals – a sign the worst my be over. The third and final phase is the recognition period, a period of recognition the old bear is dead and we do indeed have a new bull market. Sideline cash begins to look for lagging stocks that were forgotten during the logical advance of the second phase

Last week I ran a stock scan or filter seeking stocks that were breaking up out of a 10-week price channel and seeking out overlooked stocks that were “hibernating” or base building. Our chart is the weekly closes of one selection, Sherritt International Corporation (TSX-S) spanning about 100 weeks. I have overlaid the 10-week price channel and some relative analysis work. For a list of selections follow this link: http://www.gettingtechnical.com/04_analysis/01_filters.shtml

Sunday, March 7, 2010

If it Looks Like a Bull, and Walks Like a Bull:

As far as I know there is no precise definition of a bull market. Ned Davis Research define a bull market to be: A Bull Market requires a 30% rise in the Dow Jones Industrial Average after 50 calendar days or a 13% rise after 155 calendar days. This is an important benchmark for all market participants because there are still investors and portfolio managers out there who are just now getting invested having missed all of the great 2009 advance. I know of one local portfolio management firm that actually managed to lose money in 2009!

The Ned Davis definition is important but I think an easier way to identify the bull is to firstly identify the bear. So if we can ID the bear then we know the bull because you can’t have both operating at the same time. I would define a bear market to be a market as measured by the S&P500 or the S&P/TSX60 that posts a new 52-week low within a 26 week window.

Our chart is the weekly closes of the S&P500 spanning about 4+ years. We can clearly see the great 2007-2008 bear and the subsequent 2009 – 2010 bull. Of course this is easy with the benefit of hindsight but when you overlay the weekly or intermediate cycle you can clearly ID the bear which flashed a new 52-week low within the 26-week window in Q3 of 2007. The new 52-week lows within the 26-week window persisted until March 2009.

The failure of the bear to post a new 52-week low by late July through early August 2009 signalled an “official” departure of the bear and so with the bear gone – we must have a bull. When we have a bull we get invested pronto – investing is not a spectator sport – you have to participate. It is all well and good to buy-and-hold and know when to sell – but to miss the next bull market is portfolio damage that cannot repaired

Monday, March 1, 2010

When your lost, follow the Bellwether:

A bellwether is an important stock that is a component of a bull market. If the bellwether is healthy, so is the broader market. If the bellwether gets into trouble – run. A bellwether should be a component of a key sector such as the Financial, Industrial or Technology sectors. Rarely do we find bellwethers in the Consumer, Energy, Health Care and Materials sectors

The term bellwether is derived from the Middle English Bellwether which refers to the practice of placing a bell around the neck of a castrated ram - (a wether) in order that this animal might lead its flock of sheep. The sheep in this example would be the investment sheep that tend to follow the shepherd to safety or slaughter. Shepherds can be found in the business dailies and on business television. The problem is the investment sheep have no idea who the good and bad shepherds are and so the best strategy is for the sheep to follow the bellwether.

In the U.S. market one important bellwether is the technology component Cisco Systems, Inc. Cisco is a proxy for to-day’s global technology space and a healthy Cisco is a condition for a bull market in global equities.

Our chart is the weekly closes of Cisco spanning about 8-years. I have overlaid the two important stock cycles – the longer term bull & bear cycle and the shorter term weekly or intermediate cycle. Here is how to read the two. Firstly note the importance of cycle summation which occurs when the longer and shorter cycles are running in the same direction. So when the monthly and the weekly cycles are turned upward we tend to get a big advance and when the longer monthly and the weekly cycles are turned downward we tend to get big declines. The other trick is to count the weekly cycles in a monthly bull (5) and the weekly cycles in a monthly bear (3). So far we are looking good with a monthly up cycle and a pending 2nd weekly up cycle.