This is a follow up on a piece I authored entitled - Life is a gamble, so don't be a mercantile mollusc. Below is the original text which appeared in the Toronto Star on Sat Nov 21, 2009.
----------------------------------------
Life is a gamble, so don't be a mercantile mollusc.
Last week, an investment reporter asked four prominent market strategists for their take on the market's valuation. David Rosenberg of Gluskin Sheff and Associates said: "No matter which way you look at it – forward P/E, trailing P/E – the market is vastly overpriced, (and) so the strategy is to sit on the sidelines, be selective in our equity choices, and wait for the correction to come or for the fundamentals to catch up with this overvalued, overbought, overextended market." Another said: "People who are raising the red flag about markets being overvalued are those who missed the rally."
While entertaining, the confrontation is simply a minor bull and bear scrum stimulated by a financial writer asking an irrelevant question. The market is never priced on what stocks are worth today, but rather what stocks will be worth several quarters from now. The markets are forward looking and that is why the "valuations" never catch up to rising prices in a bull market.
These are harmless bull and bear arguments that are, for the most part, just noise and quickly forgotten.
The real danger to the average investors are the professional fear mongers, who use fear to influence the opinions and actions of others towards some specific end. The feared object or subject is sometimes exaggerated, and the pattern of fear mongering is usually one of repetition, in order to continuously reinforce the intended effects of this tactic. Inciting fear is also a technique to gain notoriety and influence. Some financial advisers and money managers use fear mongering as a means to attract investors to the safety of their enterprise and away from their current and supposedly dangerous adviser.
I recall a "Night with the Bears" held on April 7, a speaker's series organized by Sprott Asset Management. Guests include Eric Sprott, Meredith Whitney of Meredith Whitney Advisory Group, Nouriel Roubini of New York University and Ian Gordon, author of The Longwave Analyst newsletters.
A packed house gasped as "lunatic fringe" cycle expert Ian Gordon predicted the Dow Industrials would hit 1,000 before this downturn is over. Gordon's analysis is based on the Kondratiev long wave or K-wave which spans about 50-plus years as measured from trough to trough.
Fear mongering can sway many investors into avoiding any type of risk. Sit on cash and don't invest. Don't buy a house. Don't change jobs. Don't borrow. Don't start a business and don't trust anyone.
The following is a quote from the classic publication, Reminiscences of a Stock Operator by Edwin LeFevre: "Among the hazards of speculation the happening of the unexpected, I might even say of the unexpectable, ranks high. There are certain chances that the most prudent man is justified in taking – chances that he must take if he wishes to be more than a mercantile mollusc.
"Normal business hazards are no worse than the risks a man runs when he goes out of his house into the street or sets out on a railway journey (and) life itself from the cradle to the grave is a gamble and what happens to me because I do not possess the gift of second sight I can bear undisturbed."
I recall a recent conversation with a good friend whose daughter had just bought a small house in a Hamilton suburb. "She's crazy," he said. "Paying that much and going into debt like that." I responded; "Calm down, I have owned several homes over the past 40 years and I paid too much for every one of them. My first East York bungalow cost me $18,000."
Most of the financially independent people I have met acquired their wealth either by inheritance, real estate, stocks or a family business. Although most of us will never inherit a fortune or own a successful business we should at least take on some risk in the form of home and/or common stock ownership.
Our chart this week is 25 years of monthly closes of our own TSX Composite stock index plotted above the average Greater Toronto resale home price. The longer term trend for both asset classes is upward with the TSX returning about 10 per cent annualized and the single family home returning about 5 per cent annualized.
The higher return of stocks is accompanied by higher volatility and lower return of the home is accompanied by tax-free gains and shelter. All and all, both are worth the risk, so don't be a mercantile mollusc.
----------------------------------------
On Tuesday, December 22, 2009 Jason K. Rogers, Business Development Manager Longwave Group emailed me the following comments
Dear Mr. Carrigan,
I am writing with respect to your recent article, wherein you made reference to 'A night with the Bears', hosted by Sprott Asset Management on April 7, 2009. I was interested to read that "A packed house gasped as lunatic cycle expert Ian Gordon predicted that the Dow (Jones) industrials would hit 1,000 before this downturn is over." How would you know what the reaction of the crowd was since you declined to attend? On April 11, 2009, you wrote, "Last Monday I got an invitation from a public relations firm to spend 'A Night with the Bears' at the Elgin
Theatre... I declined because these bears have been wearing the bearish views on their sleeves for the past several years and, quite frankly, I would rather have a root canal than sit through that again."
What precisely do you mean by 'sit through that again?' When did you last sit through a round table discussion which presented the bearish point of view? Your bias is showing! Wouldn't it assist you to keep an open mind by listening to another point of view? Your perpetual bullishness appears to be based upon nothing more than the fact that you hate bears?
As for Mr. Gordon's lunatic cycle interpretation, clearly you haven't visited his website www.longwavegroup.com. If you did, you would realize that Mr. Gordon has been consistently correct in predicting the financial and economic events that are now occurring. This is not "fear
mongering," rather, it is called being realistic. Mr. Gordon has clearly demonstrated that history does repeat itself. He has convincingly, reasoned that we are now repeating the deflationary depression of the 1930s, and that's not bullish.
Acting upon his long wave economic cycle interpretations, Mr. Gordon has increased the value of his RRSP more than twenty-fivefold since May, 2002. There is an old saying within the investment industry: "There are times when bulls make money, bears make money, but pigs make
nothing!"
Kind regards,
Jason K. Rogers
Business Development Manager
Longwave Group
-----------------------------------------
Bill Carrigan's response to Jason K. Rogers – point by point and then a general observation
Hello Mr. Rogers - In response to your questions and opinion:
Q: How would you know what the reaction of the crowd was since you declined to attend?
A: Although I declined to attend, a Globe & Mail business writer did so and commented on the crowd reaction and also suggested that attendees upon leaving should have been provided with razor blades.
Q: What precisely do you mean by 'sit through that again?' When did you last sit through a round table discussion which presented the bearish point of view?
A: The business media is loaded with fear mongering "experts" seeking attention to further their personal business enterprise. I and others have heard it all. I guess you forgot about the BNN interview before the "night with the Bears"
Q: Your perpetual bullishness appears to be based upon nothing more than the fact that you hate bears?
A: I am not a perpetual bull - I wrote and spoke publicly about the breakdown in the financial stocks early in 2008. I don't hate bears but I have little regard for "off-the-wall" calls that are an embarrassment to legitimate non-conflicted analysis. A call for Dow 1000 is a desperate attempt to grab some attention in the business media. At Dow 10,000 we need one half of the components to go to zero and the other half to lose 50% just to get to Dow 2500.
Q: As for Mr. Gordon's lunatic cycle interpretation, clearly you haven't visited his website www.longwavegroup.com. If you did, you would realize that Mr. Gordon has been consistently correct in predicting the financial and economic events that are now occurring
A: Yes I did visit the web site and yes I am well aware of the fourth Kondratieff winter and have read Gordon's bearish item - The Long Wave Analyst - January 2003, Volume 5 Issue 1, 20 pages commenting on The Kondratieff Winter and the looming Depression. I quote Jonathan Chevreau - Financial Post Tuesday, June 10, 2003 item, "Gordon believes we are currently recapitulating the 1930s bear market and are in the beginning stages of a deflationary depression, similar to the thesis Robert Prechter Jr. takes in his bestselling book, Conquer the Crash." Can I reasonably conclude that Mr. Gordon missed the great 2003 - 2007 global bull market in equities and I also gather he has missed the great 2009 global bull market in equities?
Q: Acting upon his long wave economic cycle interpretations, Mr. Gordon has increased the value of his RRSP more than twenty-fivefold since May, 2002.
A: 25 fold? Are you really claiming Gordon and his clients each turned $10,000 into $250,000 since May, 2002?
-----------------------------------------
And now the reality of the Kondratieff Long Wave (K-Wave):
The trough to trough span of the K-Wave is about 52 years and so we as humans will only experience two troughs or two peaks in one life-time. The idea of planning our lives to "fit" the K-Wave is silly. Can you imagine a young family in the Kondratieff Spring of the 1960's committing to home ownership, children, common stock investing, that summer cottage, travel and consumer spending just because of a Kondratieff Spring? Can you now imagine the same family baling out of their home, their stock portfolio to buy gold in the 1980's because it is a Kondratieff Autumn?
One minor detail - there is no correlation between equity prices and the K-Wave. The two best time to buy equities was in 1942 (Pearl Harbor and a K-Wave Spring) and again in 1982 during a K-Wave Autumn. There is also no correlation between wars and the K-Wave. The U.S. Civil War occurred during a K-Wave Spring and WWII occurred during a K-Wave Winter.
I also have a problem with Gordon's K-Wave trough target of year 2020. With a 52-year cycle and the last trough at 1950 I get an idealised trough at year 2002. I gather the next K-Wave Winter is scheduled to begin in year 2050 and if I'm still above the grass I'll be too old to give a damn
One final note, I recall the Y2K fiasco when on January 1, 2000 all of the doom and gloomers vanished. What will become of the Longwave Group when we enter a K-Wave Spring?
Bill Carrigan
Tuesday, December 29, 2009
Thursday, December 10, 2009
The December Free Lunch
December more than any other month is loaded with seasonality folklore which is recycled annually in the business dailies.
The seasonality bible is the Stock Trader’s Almanac first published in 1967. This book allowed Mr. Hirsch to distil his lifelong interest in stock market history, cycles and patterns into a practical working tool for the average investor. It was the first compilation of the market’s seasonal trends and tendencies combined with a calendar and laid out for use by non-institutional investors.
One of the mid December seasonal plays is the “free lunch” wherein investors tend to get rid of their losing stocks near year-end for tax purposes. This often has the effect of driving the prices down to near 52-week lows. The Stock Trader's Almanac has shown that NYSE stocks selling at their lows on December 15 will usually outperform the markets through the following late January and early February. I assume the TSX would follow the same model.
I ran a stock filter on the listed TSX stocks seeking out issuers that were trading too far below their 100 day moving averages on a historical basis. About 80 names popped up as candidates for attracting tax-loss sales over the next few weeks. If our “free lunch” theory works these names should deliver nice above market rebounds through January and into mid February of 2010.
Our chart below sets out two likely suspects for a January – February rebound

Saturday, November 28, 2009
The Commodity Party – Time to Leave
Experience has taught me one thing for certain about investing – that is when something is certain, it us usually not certain. What I mean is, when we all know for sure – the “for sure” thing is not for sure. Right now we all know the U.S. dollar is going to zero and commodities are going to the moon – so keep selling the dollar and keep buying those commodities.
Experience has taught me to avoid over-crowed trades – to always be on the lookout for sheep-like investment behaviour. Right now too many sheep-like analysts love Baah Baah Rick Gold (TSX-ABX) and so I bailed last week at $47.
Our very long term chart below illustrates the cyclic path of the current secular advance in two of the important commodities – gold and crude. A secular trend (up or down) is a long term advance – usually 12 years – that is interrupted by shorter bull and bear cycles. The structure of the secular advance can be seen when broken into 5 cycles
Cycle (1) is the recognition of survival cycle wherein the market anticipates the survival of many smaller O&G producers and mining companies. The fundamentals are still weak. Cycle (2) is the big “money” cycle wherein anything you own in the sector goes up. Cycle (3) is the disappointing cycle when investors discover some headwinds such as squeezed profit margins and environmental concerns. Cycle (4) is the sheep cycle, the speculative bubble. The fundamentals are strong but divergences appear as not all components enjoy the bullish stampede. Cycle (5) can be a bull trap or a bear market rally that may or may not make new highs. Clearly the lower fruit has been picked – leave the higher stuff for the sheep.

Tuesday, November 24, 2009
Why Business Writers Love December
December more than any other month is loaded with seasonality folklore which is recycled annually in the business dailies.
It all begins with the U.S. Thanksgiving trade wherein you buy at the beginning of the week and then sell into strength on the Friday. We then move on to the December “free lunch” and then the Santa Claus Rally which is followed by the January Effect and finally the January Barometer.
The seasonality bible is the Stock Trader’s Almanac. Jeffrey Hirsch is editor-in-chief of the Stock Trader's Almanac and Almanac Investor newsletter. He started with the Hirsch Organization in 1990 as a market analyst and historian under the mentorship of his father Yale Hirsch the founder of the Stock Trader’s Almanac. Drawing on years of market study, Yale created the unique Stock Trader’s Almanac, in 1966. It was first published in 1967. This book allowed Mr. Hirsch to distil his lifelong interest in stock market history, cycles and patterns into a practical working tool for the average investor. It was the first compilation of the market’s seasonal trends and tendencies combined with a calendar and laid out for use by non-institutional investors. It also brought to the general public many “statistically predictable” market phenomena that have since become well known, such as the impact of the four-year Presidential Election Cycle, plus discoveries such as the “January Barometer” and the “Santa Claus Rally.”
Unfortunately only a few seasonal trends are supported by technical analysis – the most important of which is the January Effect – a period beginning mid December through the following January where the smaller companies may outperform the larger companies. A weak January Effect is a bad omen and could be a negative for the next twelve months.
A must read - The Stock Traders Almanac – visit: www.stocktradersalmanac.com

Thursday, November 19, 2009
Managed Exchange Traded Funds?
Whatever happened to the actively managed mutual fund vs. the passive index or sector exchange traded fund (ETF) battle?
Several years ago investors began to flee active mutual fund managers because for the most part, they failed to match the performance of their benchmark index or stock sector. The investment industry responded with cheaper passive ETFs that tracked the performance of the major stock indices (index funds) and sectors such as Financials, Energy, Materials and so on. Now the manufactures of ETFs have a problem – there are just too many – too much competition and so they have invented a new product – the actively managed ETF. So now we go full circle – from actively managed mutual funds to passive ETFs and now back to actively managed ETFs.
One of the original active ETF entries was PowerShares FTSE RAFI US 1000 Portfolio (NYSE:PRF) which seeks investment results that correspond generally to the price and yield of an equity index called the FTSE Research Affiliates Fundamentals US 1000 Index. The Index is designed to track the performance of the largest United States equities, selected based on four fundamental measures of firm size: book value, cash flow, sales and dividends. The 1000 equities with the highest fundamental strength are weighted by their fundamental scores
Here is the shocker – on November 18, 2009 -- Research Affiliates LLC announced that the United States Patent and Trademark Office has approved the issuance of U.S. Patent No. 7620577 for the company's innovative Research Affiliates Fundamental Index® ("RAFI®") indexing methodology, which selects and weights securities using fundamental metrics of company size rather than by market capitalization.
In other words a large cap value fund has a patented managed methodology – all very stimulating because if the methodology is patented - it must be good. Right? Well, let me now compare the “patented” managed fund to another large cap value fund, its called the Dow Jones Industrial Average, a basket of America’s biggest value companies – most of them multinationals. The best way to compare the difference is to use a simple spread or ratio chart. The inception of the fund is December 2005 and the Dow (now over 100 years old) recently had two components vaporized in the 2008 financial crisis. Our simple spread clearly the passive Dow out performed the managed ETF through 2006, 2007 and 2008 with the ETF posting an out perform only from March 2009 to October 2009.
The other problem with the managed ETFs is their poor liquidity and low volume. For example at the close of November 19 the PRF was bid 46.67 and ask 47.80 with total volume 28,240 The competing Diamonds Trust (NYSE:DIA) was bid 103.63 and ask 103.77 with total volume 12,739,200
Now if anyone out there knows of a managed ETF that works I am all ears

Sunday, November 15, 2009
Research In Slower Motion

One of the rules of successful investing is to not get distracted by the noise served up on a daily basis by the business media. When we focus on stuff like auto sales, housing starts, consumer spending, Chinese growth and forecasts by TV personalities like Dr. Doom and the Raging Bull we overlook what the markets are telling us
Did anyone out there notice the new 52-week high posted last Friday by the Technology Select Sector SPDR Fund (NYSE-XLK). Yes – the tech stocks are attracting money – we seem to have another technology boom - probably driven by the global economy.
The Canadian peer - the TSX listed Information Technology Index (XIT) is lagging because if the heavy-weight component Research In Motion problems. There is growing concern about increasing Smartphone competition and the potential for longer-term declining ASPs (average selling prices) and profit margins.
The reality is RIM, the corporation is going through transition from a youthful risky enterprise into a middle age cash cow - basically a fourth Elliott Wave – a long period of transition - unless RIM an do an Apple and re-invent itself. By the way, Elliott fourth wave periods are confirmed when the original innovators are distracted by self-serving irrelevant hobbies such as collecting art, professional sport franchises and kite surfing.
Wednesday, November 11, 2009
Fear mongering
Do you grow weary of the persistent use of fear mongering as a tool by the financial media to attract an audience?
According to http://en.wikipedia.org/wiki/Fear_mongering - fear mongering (or scaremongering) is the use of fear to influence the opinions and actions of others towards some specific end. The feared object or subject is sometimes exaggerated, and the pattern of fear mongering is usually one of repetition, in order to continuously reinforce the intended effects of this tactic.
Inciting fear is a technique to gain notoriety and influence. Some financial advisors and money managers use fear mongering as a means to prospect for new clients - to attract investors to the safely of their enterprise and away from their current and dangerous advisor.
I recall a "Night With The Bears" April 7, 2009 in Toronto, a speaker's series organized by Sprott Asset Management. Guests include Eric Sprott, Meredith Whitney of Meredith Whitney Advisory Group, Nouriel Roubini of New York University and Ian Gordon, author of The Long Wave Analyst newsletters. My invitation said this is the first time these "four spectacular Bears", (Roubini, Sprott, Whitney and Gordon) will be together on stage discussing the economy
A packed house gasped as "lunatic fringe" cycle expert Ian Gordon predicted the Dow Industrials would hit 1000 before this downturn is over. Gordon's analysis is based on the Kondratiev long wave or K-wave which spans about 50+ years as measured from trough to trough.
So as investors we must fear the worst - avoid any type of risk - don't invest - don't buy a house - don't change jobs - don't trust anyone - don't borrow - don't believe in our way of life - hide or you get H1N1
The following is a quote from the classic publication, Reminiscences of a Stock Operator by Edwin Lefavre
Among the hazards of speculation the happening of the unexpected – I might even say of the un-expectable - ranks high. There are certain chances that the most prudent man is justified in taking – chances that he must take if he wishes to be more than a mercantile mollusc. Normal business hazards are no worse than the risk a man runs when he goes out of his house into the street or sets out on a railway journey. When I lose money by reason of some development which nobody could foresee I think no more vindictively of it than I do of an inconveniently timed storm.
Life itself from the cradle to the grave is a gamble and what happens to me because I do not possess the gift of second sight I can bear undisturbed.
I rest my case.
Monday, November 9, 2009
The pot calling the kettle black
Sean left a new comment on your post " For GT Blog October 25, 2009":
Kudos Bill. I love your site and subscribe via RSS on myYahoo. I also have a soft spot for your analysis because you - like me - still us Supercharts, even though there are far more fanciful packages available. I have made the same criticisms to colleagues and have not renewed for 8 years because of the chicanery. The last meeting I went to was "guest led" by a Montreal businessman that hounded me for a subscription for years. I would like to point out, however, that your site is not immune from vendorville, as you have Google ads (the latest one promises 700% stock picks) on your site. Remove these and your credibility goes up even further in my view.
GT's reply
Hello Sean
Some very good points - the Google ads on my blog site do have a "sleeze" factor and they will be removed along with other changes to GT's web site. I am going a step further and removing any links or connection to any site or blog posing to be independent and then acting as a shill for advisors trolling for clients. Unfortunately Don Vialoux and his daily reports on timingthemarket.ca has taken this unfortunate path in accepting sponsorship from Castlemoore Inc an advisor who is trolling for clients
Bill Carrigan
Tuesday, November 3, 2009
Cycle Summation
For GT Blog November 03, 2009
Hello fellow bloggers
The current corrective period that began with the cyclic peak of the TSX Financial Index on September 30, 2009 is frustrating the bulls and giving the bears more hope for the big down so they can finally get long and participate in the current bull market
Some cycle work of the late, great Ian S. Notley as set out in his May 1995 publication Cycles And Methodology may provide some clarity during noisy and confusing periods such as now – so let us look firstly at the longer term monthly cycle
The longer term cycle is monitored on the charts by investors using monthly observations with one cyclic bottom juncture approximately every 4 to 4 ½ +/- years. The bull phase generally persists for 28 + /- months duration and the bear phases are generally of 15 +/- months duration. The origin of the last juncture was a bear trough in most of the major stock indices on April 30, 2009 thus aging the current bull at only 6 months.
The shorter intermediate term cycle is monitored on the charts by traders using weekly observations. The intermediate trend cycles are measured trough to trough and are 20 +/- weeks apart. There are about three intermediate trend junctures per calendar year (one bottom and two tops or two tops and one bottom). The bull skew is 12+/- weeks and the bear skew is 8+/- weeks. The origin of the last juncture was the October 2 peak in most of the major stock indices – aging the current bear skew at 4 weeks.
The very short term cycle is monitored on the charts by speculators for trading OR by traders and investors seeking to time the entry and exit of the weekly and monthly top and bottom junctures. The very short term trend cycles as measured from trough to trough are about 39+/- days apart with the bear skew spanning about 14 +/- days. The origin of the last juncture was the October 23 peak in most of the major stock indices – aging the current bear skew at 8 days
Now with our three cyclic positions mapped out we can plot a course for the broader equity markets over the next several weeks
Over the next 4 to 6 trading days the very short term daily cycle will trough and exert upward pressure on the current bear skew of the intermediate weekly cycle. By mid November the intermediate cycle will trough and set up a condition we call summed cyclicality which is the sum of the movements of all three market rhythms – in this case upward for at least 12 weeks taking us to the peak of the next intermediate cycle sometime in mid to late January 2010
So get long and enjoy
Wednesday, October 28, 2009
For GT Blog October 28, 2009
Don Vialoux has removed me from his mailing list in reaction to my CSTA rant last week. I will miss Don's analysis because I have an interest in the TSX listed Tim Hortons Inc. (THI) which would hopefully pass three of Don’s tests – seasonality – fundamentals and the technicals. I am weak on the seasonal and fundamental issues so I will give it a try – some feedback would help
Seasonality
Seasonal affective disorder (SAD) takes its toll on millions of North Americans each year, a condition that leads to depression, anxiety, and chronic fatigue as the winter months ensue. It's one reason why people migrate to sunnier quarters during winter season – or in the alternative remain in Canada and eat more donuts.
Fundamentals
A simple observation of the Hortons’ drive through any morning clearly shows that Canadians love their morning coffee and donuts. When the Hortons’ medium coffee cup is examined for volume it is clearly less than the McDonald's medium cup – at about the same price – this tells me Hortons’ make more money per serving – (personally I like the McDonald’s coffee)
The Technicals
The chart below displays a huge symmetrical triangle which tends to precede a major move – up or down. The lower study is a relative analysis test which is showing recent improvement in THI vs the TSX Composite. Hortons is also a “safe” place to hide when investors seek to leave the riskier assets – watch for the break to the upside 
Seasonality
Seasonal affective disorder (SAD) takes its toll on millions of North Americans each year, a condition that leads to depression, anxiety, and chronic fatigue as the winter months ensue. It's one reason why people migrate to sunnier quarters during winter season – or in the alternative remain in Canada and eat more donuts.
Fundamentals
A simple observation of the Hortons’ drive through any morning clearly shows that Canadians love their morning coffee and donuts. When the Hortons’ medium coffee cup is examined for volume it is clearly less than the McDonald's medium cup – at about the same price – this tells me Hortons’ make more money per serving – (personally I like the McDonald’s coffee)
The Technicals
The chart below displays a huge symmetrical triangle which tends to precede a major move – up or down. The lower study is a relative analysis test which is showing recent improvement in THI vs the TSX Composite. Hortons is also a “safe” place to hide when investors seek to leave the riskier assets – watch for the break to the upside
Sunday, October 25, 2009
For GT Blog October 25, 2009
I am still done with the CSTA in spite of Don Vialoux’s opinion that my comments were “over the top and not in (my) best interests.”
The reality is the CSTA is the only professional organisation that allows industry professional members to use the resources of their organisation (the CSTA) for the purpose of soliciting, urging, requesting, enticing or otherwise promoting their services to individual investors.
I know because I attended many public CSTA promotions at various financial forums and witnessed CSTA members pimping their services to private investors who were initially curious about the benefits of membership. A classic bait and switch technique.
The foxes ambushing the chickens
Log on to www.advocis.ca - The Financial Advisors Association of Canada - a platform of knowledge, advocacy, community and protection enhancing the professionalism of financial advisors and planners in the best interest of the consumer. Only industry professionals can be members - scan the list of directors – no contact info – with the exception of name@advocis.ca
Scan the list of CSTA directors – the contact info is directed to their personal business enterprise. Some of the directors email reply names are almost egregious – not suitable for a professional organisation - some examples "Wi$eMoney.ca" and “analyzingmarkets.com” – only one director has non predatory contact information - Deborah Shaman, Ottawa Regional Director - ottawa@csta.org
The foxes ambushing the chickens
One would wonder why an industry pro who may - or may not have any accreditation or reputation of being a technical analyst would worm their way onto the list of CSTA directors. There can be only two answers – firstly it is an easy way to add some impressive stuff to their resumes – something like “Billy Bob is past President (or) former director of the Canadian Society of Technical Analysts (CSTA)”.
Secondly why would a director want to post all of their professional contact information on a busy web site?
The foxes ambushing the chickens
This predatory behaviour only adds to the public perception that technical analysis is “voodoo science” or “lunatic fringe” activity. The fact that holding a CMT does little to impress the regulators or the financial services industry as to accreditation is a serious problem for the profession. That is why some CMT’s will also acquire a CFA or CIM to ensure employment opportunity
Now before all you CMTs out there complain - go to Advocis / find an advisor http://www.advocis.ca/content/find-ad-form.aspx and look at the search - Financial designation options CFA, CFP, CH.F.C, CIM, CLU, CMP, R.F.P, REBC, RHU and TEP – no CMT found here
There is more – look at IIROC the list CE Accredited Courses for Cycle 4 (2009-2011) Professional Development - IIROC is the national self-regulatory organization which oversees all investment dealers and trading activity on debt and equity marketplaces in Canada - the link:
http://cecap.ca/cy4//en/index.php?pageNum_pd_c3_members=0&totalRows_pd_c3_members=66&mod=providers_pdc3&cyc=04&cat_type=PD
No mention of the CSTA here but one can get 4 credits by watching a presentation by Thomson Reuters Markets Academy
Don I know you were – and I quote - “sad about Bill’s comments for a number of reasons: The comments were not specific. More information about his concerns are needed by the CSTA board before it can respond.”
So there you go – specifically yours – Bill Carrigan
Wednesday, October 21, 2009
For GT Blog October 22, 2009
I am done with the CSTA
The CSTA (Canadian Society of Technical Analysts) claim their mission to be “To promote Technical Analysis at both academic and professional levels, through education and the sharing of knowledge with the community of technical analysts and the investment industry, and through the establishment and fostering of the highest standards.”
When I became a member several years ago I assumed the CSTA to be a professional organization on a par with peers such as Certified Financial Planner Board of Standards, the CFA Institute, the Financial Planners Standards Council and The Financial Advisors Association of Canada (Advocis)
Dig this mission statement from Advocis, “The Financial Advisors Association of Canada provides a platform of knowledge, advocacy, community and protection enhancing the professionalism of financial advisors and planners in the best interest of the consumer.”
The bottom line, the private investor is the direct beneficiary of these professional organizations because they know - in the long run – when investors are well served – their profession is also well served – everybody wins
I have in the past made several public presentations on behalf of the CSTA with a view to encourage industry pros and private investors to incorporate some form of technical analysis into their investment strategy. My last presentation was at the June 2009 CSTA annual meeting in Toronto.
I have always held myself out to be an educator and not salesman looking for new business - Unfortunately over the past few years the CSTA has morphed into a shill or platform for industry salesmen to fish for new clients - the board of directors is littered with salesmen who seek to use the organisation as a platform to promote their own self interests
So here is my challenge to the CSTA - a new rule
No member of the CSTA shall use the organisation to promote their own self-serving agenda - this would forbid industry professionals from using the CSTA platform for interaction with private investors and the business media to promote their own personal business enterprises
Do this and I bet one-third of the directors would resign
Do this and I would reconsider my membership
Bill Carrigan
Friday, October 16, 2009
For GT Blog October 10, 2009
More on investment myths and investment folklore
It has taken me years to discover that low investment costs such as cheap trading commissions and low management fees have little to do with successful investing – those low trading fees can encourage over-trading resulting in you “giving away” good stocks because of the removed commission barrier.
During the 2007-2008 financial melt-down those low MER exchange traded funds collapsed at the same rate as their more expensive mutual fund peers – does saving the extra 1.5% fee make you feel better when your down 35%?
The reality is most of your investment returns are determined by bull & bear markets, proper sector selection and the current dominant theme
The dominant theme will lead a secular up-trend which is a long-term trend that can persist for several years. These long trends are interrupted by the shorter, four-year bull and bear cycle, hence the term “secular trend.’
The first modern secular uptrend was the post-World War II boom of 1949 through 1966. It ended when the Nifty Fifty buy-and-hold asset bubble popped in response to rising oil prices. This introduced the first modern secular downtrend that persisted though the 1970s. The crisis was the 1973 Arab Oil Embargo.
In the early 1980s, the new-economy companies took flight and the great 1982-2000 second modern secular uptrend was on. All investors had to do was buy and hold. Today, the tech-laden Nasdaq composite at the 2,000 level is still ten times the 1982 level of under 200 on the index.
In the late 1990’s savvy investors enjoyed the energy theme which ended with the great crude spike of 2008 - a ten-year run that drove the TSX Energy index from a 1998 low of 50 to a 2008 peak of 470 – up over 800% for a 10-year annualized return of over 25%
Clearly we need a new dominant theme
I will be a presenter at the World MoneyShow Toronto - Metro Toronto Convention Centre Thursday October 22, 2009 from 4:15 pm to 5 pm. I will explain secular trends and seek out the new dominant investment theme.
I invite you to join me - follow this link for more information http://www.moneyshow.com/toms/wBios.asp?id=1155FT1
Tuesday, October 13, 2009
For GT Blog October 14, 2009
Rickyisms is the term devised by the fans of Trailer Park Boys for Ricky's malapropisms. They are often used due to poor education, extensive drug and alcohol use, and situations where he may not be thinking clearly
Example; "Get two birds stoned at the same time" instead of "kill two birds with the same stone"
I have recently picked up on Dennis Gartman and his Gartmanisms.
Dig these classics, "In bull markets we can only be long or neutral, and in bear markets we can only be short or neutral. That may seem self-evident; it is not, and it is a lesson learned too late by far too many" - so we can be neutral all the time?
"All rules are meant to be broken: The trick is knowing when... and how infrequently this rule may be invoked!" - say what?
"I am currently short the U.S. dollar and long the Canadian dollar" - a double short?
"I am long gold but I do not like gold, sorry gold bugs" - either way he wins.
Gartman also thinks the rising Canadian loonie is great for Canadians - I wonder which Canadians that could be - certainly not Alberta's energy industry and not Ontario's gutted manufactures - sorry I forgot there are some benefits to a strong loonie - vacations to Barbados and the big Chinese importers like Canadian Tire.
Thursday, October 8, 2009
For GT Blog October 10, 2009
I often laugh-out-loud (LOL) when a “portfolio manager” is a guest on a business TV show – be it CNBC, BNN or CBC – they talk fundamental stuff like ROE, the balance sheet, the earnings outlook, the dividend coverage, the book value all “going forward” of course. Then they slip and make a technical comment – “there is support at” or “just over the 50-day” they snap out of it and quickly get back to gross margins.
The only reason I got my CIM designation was because I need to know how these guys think. Basically they all get sucked in by the compelling storeys served to them by the companies they “investigate”. It is not about lying – it is about misinformation or the lack of truth. Do the analysts and the auditors ever really know what those assets are worth? I recall Allen-Vanguard Corp at $10 (now worth nothing) being very focused on Iraq and roadside bombs.- winning contracts and there was great optimism that big sales will continue and big earnings to come. Don’t get me started on Timminco Ltd
As a technician I believe the worst – the companies misinform the auditors, the auditors misinform the banks, the banks pass the misinformation to their analysts who misinform the portfolio managers who get on TV and misinform the viewers.
The bottom line is the smart money always wins – the smart money gets in first and gets out first – you and I will never be the first to know – our only defence to follow the money and ignore those compelling stories
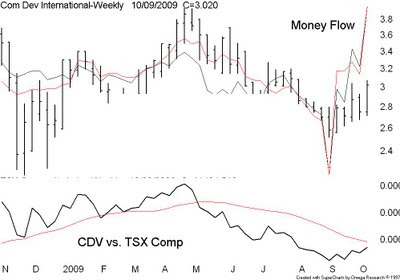
I bought some COM DEV (TSX-CDV) last week because of the soaring money flow numbers – CON DEV is manufacturer and distributor of space communications and space science products – I have no idea of the outlook for the company - only the insiders know that - I am just following the money honey
The only reason I got my CIM designation was because I need to know how these guys think. Basically they all get sucked in by the compelling storeys served to them by the companies they “investigate”. It is not about lying – it is about misinformation or the lack of truth. Do the analysts and the auditors ever really know what those assets are worth? I recall Allen-Vanguard Corp at $10 (now worth nothing) being very focused on Iraq and roadside bombs.- winning contracts and there was great optimism that big sales will continue and big earnings to come. Don’t get me started on Timminco Ltd
As a technician I believe the worst – the companies misinform the auditors, the auditors misinform the banks, the banks pass the misinformation to their analysts who misinform the portfolio managers who get on TV and misinform the viewers.
The bottom line is the smart money always wins – the smart money gets in first and gets out first – you and I will never be the first to know – our only defence to follow the money and ignore those compelling stories
I bought some COM DEV (TSX-CDV) last week because of the soaring money flow numbers – CON DEV is manufacturer and distributor of space communications and space science products – I have no idea of the outlook for the company - only the insiders know that - I am just following the money honey
Monday, October 5, 2009
For GT Blog October 5, 2009
In the early 1960's I was an engineering student at Ryerson University in Toronto and I had aspirations of being an acoustical engineer. A local company was introducing a radical new bass enclosure they referred to as an Acoustic Filter
When I asked the designer for the design theory he replied "why would I spend ten minutes to give away ten years of experiments?"
A few years ago the Canadian Society of Technical Analysts asked me to present the theory behind my sector rotation models. When I declined a wise old gentleman took me aside and said, "not to worry - you could explain the secret of eternal life to 1000 attendees and only one would listen!"
I gave the presentation - and the old man was right, my revelations had no cosmic effect
So with that in mind I now share another little secret of market timing using technical analysis: - the small caps lead the large caps. That is why I include the iShares CDN Small Cap ETF (XCS) in my weekly sector rotation tables. When the small caps are higher ranked than the broader iShares CDN S&P/TSX60 ETF (XIU) I get bullish and when the smaller caps rank under the large caps - I get bearish
Our chart below displays the TSX Small Caps over the TSX Large Caps - the bottom indicator is the relative perform which clearly sets out the leadership of the smaller companies - note also the higher March 2009 lows of the smaller caps
The economy sensitive smaller companies lead the way - up and down 
When I asked the designer for the design theory he replied "why would I spend ten minutes to give away ten years of experiments?"
A few years ago the Canadian Society of Technical Analysts asked me to present the theory behind my sector rotation models. When I declined a wise old gentleman took me aside and said, "not to worry - you could explain the secret of eternal life to 1000 attendees and only one would listen!"
I gave the presentation - and the old man was right, my revelations had no cosmic effect
So with that in mind I now share another little secret of market timing using technical analysis: - the small caps lead the large caps. That is why I include the iShares CDN Small Cap ETF (XCS) in my weekly sector rotation tables. When the small caps are higher ranked than the broader iShares CDN S&P/TSX60 ETF (XIU) I get bullish and when the smaller caps rank under the large caps - I get bearish
Our chart below displays the TSX Small Caps over the TSX Large Caps - the bottom indicator is the relative perform which clearly sets out the leadership of the smaller companies - note also the higher March 2009 lows of the smaller caps
The economy sensitive smaller companies lead the way - up and down
Wednesday, September 30, 2009
For GT Blog October 1, 2009
Dilemma - a noun pronounced [di-lem-uh] meaning a situation requiring a choice between two equally undesirable alternatives. The great stock market advance that began in early March 2009 has set up an investment dilemma for both the bulls and the bears.
Bearish investors assumed the great advance to be a sucker bear market rally and sat in cash alternatives waiting for a major correction - possibly back down to re-test the March 2009 lows. Dilemma, do they capitulate and buy in now and risk a correction or do they sit in cash and wait for a correction that may never materialize?
Bullish investors who enjoyed the advance assume it is a youthful bull market and fear not to remain invested. They also fear that a correction could wipe away much of their March to date returns. Dilemma, do they sell now and try to re-enter at lower prices that may never materialize or do they hold and remain fully invested and risk a correction?
We need to decide, is this a bull market or - is this a bear market? Solve that and we resolve the dilemma. If a bull market the bears should buy in now and the bulls should remain fully invested. If we still have a bear market the bears will stay in cash and await the correction and the bulls will sell and lock in those bear rally profits.
Perhaps some historical data on bull and bear markets will help when we examine the duration of the bull and bear cycle over the past 100 years.
The average duration of a bear market in months is 14-months with the longest modern bear of 1973-74 running almost 24 months. If you're a bear we are now into 24-months from the peak of October 2007. Clearly the math does not support a current bear environment.
The average duration of a bull market in months is 24-months with the longest modern bull of 1990-1998 spanning 94 months. If you're a bull we are now only 6-months from the bottom of March 2009 and so the math does not support the end of the current bull.
The other issue to support the bull market scenario is the growing number of new 52-week highs in many of the important stock sectors. Yesterday stocks listed on the Nasdaq, the NYSE and the TSX posted over 200 new highs and only 14 new 52-week lows. As we move into October most of the broader indices are approaching new 52-weeks highs. The Nasdaq is currently within 2% of the October 2008 peak and above the November 2008 peak. The all important Russell 2000 is still 15% below the October 2008 peak but above the November 2008 peak.
Our chart below looks at the TSX Composite and the Nasdaq October 2008 price targets - if these 52-week targets are overcome, the bears will capitulate and trigger a bullish stampede into equities.
Closing In - 52-week Price Targets on the TSX Comp and the Nasdaq
Monday, September 28, 2009
For GT Blog September 29, 2009
Hello fellow bloggers and stock market participants.
As you know RIM last Thursday announced continued earnings growth but warned on the potential for future pressure on margins - At the open on Friday the stock torpedoed but the broader stock indices shrugged off the bad news and continued higher.
The shares of competitor Apple Inc. are now higher than last Thursday's close
Lets us have some fun with a skill test to see if you can spot the early warnings of a RIM torpedo by spotting the early signs of negative price divergence as set up in an Apple over RIM weekly chart
Apple is stronger than RIM as measured from A to B, C to D or D to E
RIM is weaker than Apple as measured from A to B, C to D or D to E
Which stock would you buy - right now?
To learn the correct answer attend our Technical Analysis Level 1 or 2 seminar - to register go to: http://www.gettingtechnical.com/07_seminars/index.shtml
Two Smartphone Bellwethers
Tuesday, September 22, 2009
For GT Blog September 22, 2009
Let’s listen in on an advisor – client conversation
Advisor: Wow this market is really strong!
Client: How strong is it?
Advisor: It is so strong none of the O’Leary funds have made a new 52-week low since last July.
I have been a bull since the lows of November 2008 when some important stocks such as IBM, Intel & Home Depot bottomed and later followed by the March lows of just about all of the major stock indices on the planet. We are now entering the seventh month of rising stock prices and not a day goes by when I am asked for technical evidence confirming the current bull.
Most bullish technicians will point to important leadership such as the Financial, Technology and Industrial sectors posting new 10-month highs followed closely by the Materials only 5% away from a new 52-week high. This along with the failure of the bears to take the market to new lows since March.
Last Monday I chaired a conference call with the Union Securities wealth management team who for the most part have enjoyed the 2009 bull market. We were once again reviewing the evidence to support our bullish stance when out of the blue one of the advisors asked a question about the wealth management companies
I had a moment of clarity – yes the wealth managers lead and I had overlooked these important bellwethers. The table below is a list of publicly traded Canadian wealth managers sorted by time from their last 52-week low. Half of the list bottomed in 2008 after peaking in mid 2006 and 2007 – I rest my case and kudos to the Union guy. 
Advisor: Wow this market is really strong!
Client: How strong is it?
Advisor: It is so strong none of the O’Leary funds have made a new 52-week low since last July.
I have been a bull since the lows of November 2008 when some important stocks such as IBM, Intel & Home Depot bottomed and later followed by the March lows of just about all of the major stock indices on the planet. We are now entering the seventh month of rising stock prices and not a day goes by when I am asked for technical evidence confirming the current bull.
Most bullish technicians will point to important leadership such as the Financial, Technology and Industrial sectors posting new 10-month highs followed closely by the Materials only 5% away from a new 52-week high. This along with the failure of the bears to take the market to new lows since March.
Last Monday I chaired a conference call with the Union Securities wealth management team who for the most part have enjoyed the 2009 bull market. We were once again reviewing the evidence to support our bullish stance when out of the blue one of the advisors asked a question about the wealth management companies
I had a moment of clarity – yes the wealth managers lead and I had overlooked these important bellwethers. The table below is a list of publicly traded Canadian wealth managers sorted by time from their last 52-week low. Half of the list bottomed in 2008 after peaking in mid 2006 and 2007 – I rest my case and kudos to the Union guy.
Wednesday, September 16, 2009
For GT Blog September 17, 2009
Where is BNN’s Kevin O'Leary? I need to know because he was one of the best contrarian indicators on the street. I recall a March 4, 2009 BNN Squeeze Play O’Leary rant on General Electric Company (NYSE-GE - $6.69) to be a “worthless zombie stock”.
This of course was the setup for a classic buying opportunity. To-day 26-weeks later at $17 - GE is up 154% (that is 480% annualized).
We now need to know if Kevin O'Leary thinks the big March to September advance is a bull market or just a bear market sucker rally.
This is a need-to-know because our investment returns are not governed by seeking out “value” or discovering “the overlooked” or getting “inside information” or finding “cash rich” companies. The reality is bull markets boost the prices of all stocks – the good stuff and the crap – no matter, up they go and we are all expert stock pickers.
The bear market on the other hand takes everything down the toilet. The key is to recognize the bull and get long. Bears are for traders.
I think we have a bull market because of important leadership and the failure of the bears to take the market to new lows since March. Note our chart displaying the important Financial, Technology and Industrial sectors actually posting new 10-month highs. The TSX Materials is only 5% away from a new 52-week high.
Looks like a bull to me but without the O’Leary contrarian indicator I am missing that important confirmation – so be careful out there.

Tuesday, September 8, 2009
For GT Blog September 08, 2009
We got some big news last week according to The Globe, after scooping up the dominant domestic specialty lingerie chain, La Senza, in early 2007, the parent of Victoria's Secret is finally bringing its high-profile brand to Canada. Next month, it will open its first four Victoria's Secret Pink outlets here, starting in Ontario, catering to the lingerie demands of teens and twenty-something’s.
If they do an IPO in Canada don’t even think of investing – the math is terrible. We have a business that only sells only to young females or about 20% of the population. Cut that in half because according to Health Canada the proportion of obese children has nearly tripled in the last 25 years so now their target market is about 10% of the population. I think more people watched Kevin O'Leary’s last show on BNN
Gold on the other hand is loved by all and Dennis Gartman says if gold goes up it will go higher and if gold goes down it will go lower -
Our long term monthly chart illustrates the structure of the current secular uptrend of bullion. A secular up trend is a long term advance (12+ years) that is interrupted by shorter bull and bear cycles – usually about 5 in total – we are now beginning cycle 4 and so this could be the last big advance for the complex – keep in mind the last cycle (5) does not necessarily make a new high – and remember with gold we are here for a good time – not a long time

Tuesday, September 1, 2009
For GT Blog September 01, 2009
Over-trading can trigger anti-social behaviour - I drink alone - I am crabby - I frighten small children - I don't fit the norm - I don't cut my toe nails - I don't "fit in" - I like younger women - I don't read Rob Carrick - I drink too much coffee - l hate mutual fund ads - I think Kevin O'Leary is a used car salesmen.
I grow tired of gold bugs who thrive on bad news - the banks are risky - hedge funds are blowing up - the auto business is crap - you can't trust financial statements - real estate sucks - the consumer is dead - global warming - Chinese plastic everywhere - to much crappy Ontario wine at the LCBO - and now a Mission Impossible 3 movie - all too much too cope with - The gold bugs were wrong last year but this year could be their year - so time for a cold beer and to take a second look at those gold stocks - besides Dennis Gartman says if gold goes up it will go higher and if gold goes down it will go lower
Our gold stock Vs. Gold bullion chart illustrates the gold stocks under-performance Vs. bullion leading into the mid 2008 financial crisis - the gold stocks were eventually caught up in the asset liquidation of September - November 2009.
Now the relationship has changed with the gold stocks out performing the bullion price - perhaps a bullish sign for a big advance in the last quarter of 2009 -
Tuesday, August 25, 2009
For GT Blog August 26, 2009
Let us have some fun with a skill test on how to spot price divergence. Spotting divergence is a valuable asset because most analysts overlook this important signal
Divergence occurs when two lines on a chart move in opposite directions vertically. Analysts often look for divergences by comparing a stock's direction to a technical indicator or to another related stock or index. There are two kinds of divergences: positive and negative. A positive divergence occurs when the indicator moves higher while the stock is declining. A negative divergence occurs when the indicator moves lower while the stock is rising.
In all my years of teaching this is the most difficult study to explain
Question: Can you spot the "buy" signal on Talisman Energy?
(1) The divergence at A-B and 1-2?
(2) The divergence at B-C and 2-3?
(3) The divergence at C-D and 3-4?
(4) The divergence at D-E and 4-5?
(5) The divergence at E-F and 5-6?
(6) The divergence at B-G and 2-7?
If you selected 4 or 6 you would be correct - find out why on our Technical Analysis Level 1 seminar - to register http://www.gettingtechnical.com/07_seminars/index.shtml 
Divergence occurs when two lines on a chart move in opposite directions vertically. Analysts often look for divergences by comparing a stock's direction to a technical indicator or to another related stock or index. There are two kinds of divergences: positive and negative. A positive divergence occurs when the indicator moves higher while the stock is declining. A negative divergence occurs when the indicator moves lower while the stock is rising.
In all my years of teaching this is the most difficult study to explain
Question: Can you spot the "buy" signal on Talisman Energy?
(1) The divergence at A-B and 1-2?
(2) The divergence at B-C and 2-3?
(3) The divergence at C-D and 3-4?
(4) The divergence at D-E and 4-5?
(5) The divergence at E-F and 5-6?
(6) The divergence at B-G and 2-7?
If you selected 4 or 6 you would be correct - find out why on our Technical Analysis Level 1 seminar - to register http://www.gettingtechnical.com/07_seminars/index.shtml
Friday, August 21, 2009
GT Blog August 18, 2009
More on socially responsible companies and their investors
As pointed out in my previous entry there are three types of companies - value, growth and socially responsible. A value company can also be socially responsible, and a growth company can also be socially responsible.
We know that socially responsible can include, no forest clear cutting, no open pit mining, no child labour, no guns, no raping of small third world countries, and no toxic pond tailings. Optional candidates include the legal gaming companies and the producers of tobacco and alcohol products. Socially responsible companies are also sensitive to the issues of Free Trade and Fair Trade.
Free trade means buying and selling anything to anybody as long as you can make a buck. Fair trade takes into consideration the social damage of the exploitation of the exploitation of the weak. One example was the destruction of the Jamaican dairy industry which before the early 1990s was healthy, and growing. But when the Jamaican government opened up the dairy market to imports (free trade) in response to pressure from the World Bank - that changed overnight. Shiploads of cheap milk powder from Europe, produced and exported with the aid of massive EU subsidies, spelt disaster for Jamaica's dairy farmers
In my Banana Republic item I singled out Metro, Inc. (TSX-MUR.A) and Empire Company Limited (TSE-EMP.A), both engaged in food retailing to be socially irresponsible because they make no attempt to support fair trade bananas. Free trade workers work for the biggest fruit companies, receiving no benefits, no pension, no medical care, no guaranteed wage and no holidays. They are routinely sprayed with pesticides deemed illegal in North America for more than a generation.
Apparently Loblaw Companies Limited (TSX-L) is the only major food retailer supporting fair trade bananas.
There are three types of investors. Some will support socially responsible companies no matter what the loss in investment opportunity. Some will avoid socially irresponsible companies as long as there is an alternate choice and there are investors who simply could care less about anything except making a buck.
Let us now set up a hypothetical investment dilemma wherein an investor is concerned about the current over-extended equity markets. He or she now wishes to include some consumer staples stocks into the portfolio to reduce risk and volatility .
There are currently no exchange traded funds available so the investor must choose from the eleven stocks that make up the TSX Consumer Staples Index.
The table below lists the components sorted by their relative weekly price momentum as compared to the broader TSX Composite Index - we need to buy at least three components to retain some sector diversity
Note the bottom four - all food retailers - so what to do?

The supporter of socially responsible companies will select the top ranked Couhe-Tard and Saputo along with Loblaw. The avoider of socially irresponsible companies will seek out alternate choices - in this case Couhe-Tard, Saputo and Jean Coutu. The could-care-less make a buck investor will buy anything that is top ranked.
Observation - the group is currently an under-perform Vs. the broader TSX Composite - see below
Tuesday, August 18, 2009
GT Blog August 18, 2009
Dumb or annoying companies and stupid CEO commentary
There are three types of companies - value, growth and socially responsible. Now a value company can also be socially responsible, and a growth company can also be socially responsible. Occasionally you will find a company that is just plain dumb – all hype and an endless stream of bull dust press releases.
I also tend to run away from annoying companies who blow away their cash on share buybacks in order to create the illusion of earnings growth. The easiest way to spot both a dumb and annoying company is to identify a stupid CEO – who when questioned by the business media will say “my first responsibility is to the shareholders.”
Hello? Your first responsibility is to society and then your customers – do that and the shareholder "problem" will resolve itself.
Now I know that socially responsible can include no tobacco, no alcohol, no forest clear cutting, no open pit mining, no child labour, no guns and no toxic pond tailings. Socially responsible companies are also sensitive to the issues of Free Trade and Fair Trade.
If you are not clear on the difference between free and fair trade follow this link http://www.thestar.com/business/article/681602 to a stunning item in the Toronto Star - Saturday August 15, 2009 - an item called Banana Republic - a must read
Did you know that Bananas are the most popular fruit in Canada and around the world? with the average person eating 14 kilograms per year. Some 275,000 Ecuadorians work in the trade and one in every four bananas consumed in North America comes from this corner of Latin America
Despite the size of the industry, only a fraction of bananas exported around the world are considered fair trade, a certification that guarantees a degree of equity and equality for farmers. In a few countries, fair trade bananas have a big share of the market a quarter in the United Kingdom, for example. But in Canada, barely 1 per cent of bananas are fair trade.
Free trade workers work for the biggest fruit companies, receiving no benefits, no pension, no medical care, no guaranteed wage and no holidays. They are routinely sprayed with pesticides deemed illegal in North America for more than a generation.
Free trade banana workers have blamed cancers, respiratory diseases, birth defects and sterility on routine exposure to pesticides. Some, like the 16,000 workers from Costa Rica, Ecuador, El Salvador, Guatemala, Honduras, Nicaragua and the Philippines who took several fruit and chemical companies (including Dole, Chiquita and Del Monte) to court, have received settlements to compensate for their injuries.
Only 1 per cent of farmers in this region work on a fair trade organic banana plantation. One worker is quoted "They don't spray me any more," he says. "I get medical help if I'm injured at work. I even get a basket with a chicken in it at Christmas time."
Where can you get fair trade bananas in Canada? Apparently at Loblaws food stores. Loblaw Companies Limited (TSX-L) is a Canada-based company. The Company is engaged in food distribution and is also a provider of drugstore, general merchandise and financial products and services. The Company is a subsidiary of Weston Limited (Weston). The Company offers the Canada’s (private) label program, including President’s Choice, no name and Joe Fresh Style brands
Where can you NOT get fair trade bananas? Apparently not at Metro, Inc. (TSX-MUR.A) is a Canada-based food retailer and distributor. The Company operates a network of supermarkets, discount stores and drugstores in Quebec and Ontario. As of September 27, 2008, Metro, Inc. operated 558 food stores and 268 drugstores. It operates 380 supermarkets under the banners Metro, Metro Plus, A&P, Dominion and Loeb
Don’t look for fair trade bananas at the Empire Company Limited (TSE-EMP.A) which is engaged in food retailing, real estate, and investments and other operations. Food retailing is carried out through wholly owned Sobeys Inc. (Sobeys).
It seems to me the best way to punish socially irresponsible companies is to turn rich investors into poor investors by refusing to invest in the shares of these companies
Fair Trade Supporter Loblaw needs our vote 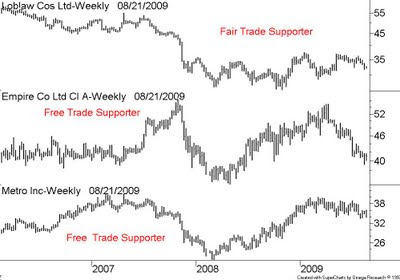
There are three types of companies - value, growth and socially responsible. Now a value company can also be socially responsible, and a growth company can also be socially responsible. Occasionally you will find a company that is just plain dumb – all hype and an endless stream of bull dust press releases.
I also tend to run away from annoying companies who blow away their cash on share buybacks in order to create the illusion of earnings growth. The easiest way to spot both a dumb and annoying company is to identify a stupid CEO – who when questioned by the business media will say “my first responsibility is to the shareholders.”
Hello? Your first responsibility is to society and then your customers – do that and the shareholder "problem" will resolve itself.
Now I know that socially responsible can include no tobacco, no alcohol, no forest clear cutting, no open pit mining, no child labour, no guns and no toxic pond tailings. Socially responsible companies are also sensitive to the issues of Free Trade and Fair Trade.
If you are not clear on the difference between free and fair trade follow this link http://www.thestar.com/business/article/681602 to a stunning item in the Toronto Star - Saturday August 15, 2009 - an item called Banana Republic - a must read
Did you know that Bananas are the most popular fruit in Canada and around the world? with the average person eating 14 kilograms per year. Some 275,000 Ecuadorians work in the trade and one in every four bananas consumed in North America comes from this corner of Latin America
Despite the size of the industry, only a fraction of bananas exported around the world are considered fair trade, a certification that guarantees a degree of equity and equality for farmers. In a few countries, fair trade bananas have a big share of the market a quarter in the United Kingdom, for example. But in Canada, barely 1 per cent of bananas are fair trade.
Free trade workers work for the biggest fruit companies, receiving no benefits, no pension, no medical care, no guaranteed wage and no holidays. They are routinely sprayed with pesticides deemed illegal in North America for more than a generation.
Free trade banana workers have blamed cancers, respiratory diseases, birth defects and sterility on routine exposure to pesticides. Some, like the 16,000 workers from Costa Rica, Ecuador, El Salvador, Guatemala, Honduras, Nicaragua and the Philippines who took several fruit and chemical companies (including Dole, Chiquita and Del Monte) to court, have received settlements to compensate for their injuries.
Only 1 per cent of farmers in this region work on a fair trade organic banana plantation. One worker is quoted "They don't spray me any more," he says. "I get medical help if I'm injured at work. I even get a basket with a chicken in it at Christmas time."
Where can you get fair trade bananas in Canada? Apparently at Loblaws food stores. Loblaw Companies Limited (TSX-L) is a Canada-based company. The Company is engaged in food distribution and is also a provider of drugstore, general merchandise and financial products and services. The Company is a subsidiary of Weston Limited (Weston). The Company offers the Canada’s (private) label program, including President’s Choice, no name and Joe Fresh Style brands
Where can you NOT get fair trade bananas? Apparently not at Metro, Inc. (TSX-MUR.A) is a Canada-based food retailer and distributor. The Company operates a network of supermarkets, discount stores and drugstores in Quebec and Ontario. As of September 27, 2008, Metro, Inc. operated 558 food stores and 268 drugstores. It operates 380 supermarkets under the banners Metro, Metro Plus, A&P, Dominion and Loeb
Don’t look for fair trade bananas at the Empire Company Limited (TSE-EMP.A) which is engaged in food retailing, real estate, and investments and other operations. Food retailing is carried out through wholly owned Sobeys Inc. (Sobeys).
It seems to me the best way to punish socially irresponsible companies is to turn rich investors into poor investors by refusing to invest in the shares of these companies
Fair Trade Supporter Loblaw needs our vote
Thursday, August 13, 2009
GT Blog August 13, 2009
Technical Analysis – myths and urban legends continued…
We know that energy stocks in both the US and in Canada are not participating in the current global stock market advance. The problem could be investor fears about a double dip recession which could kill the demand for crude. It is with these fears in mind that investors are unwilling to bid for energy stocks.
The obvious strategy for the technical analyst is to study the price of crude and natural gas in order to predict any movement in the related energy stocks. In other words the price of crude leads the price of the stocks.
On the other hand why not study the price of the energy stocks in order to predict any movement in the crude & natural gas complex. In other words the price of the stocks leads the price of crude and natural gas.
The problem is that sometimes crude leads and sometimes the stocks lead – so we must find another somewhat over-looked way to study the energy complex. I find the oilfield service stocks will often lead the energy complex. The chart below displays two oilfield services companies that are advancing during a period of little investor interest in an otherwise dull energy market. Not a sheep in sight – could be time cut your favourite energy stock from the herd 
We know that energy stocks in both the US and in Canada are not participating in the current global stock market advance. The problem could be investor fears about a double dip recession which could kill the demand for crude. It is with these fears in mind that investors are unwilling to bid for energy stocks.
The obvious strategy for the technical analyst is to study the price of crude and natural gas in order to predict any movement in the related energy stocks. In other words the price of crude leads the price of the stocks.
On the other hand why not study the price of the energy stocks in order to predict any movement in the crude & natural gas complex. In other words the price of the stocks leads the price of crude and natural gas.
The problem is that sometimes crude leads and sometimes the stocks lead – so we must find another somewhat over-looked way to study the energy complex. I find the oilfield service stocks will often lead the energy complex. The chart below displays two oilfield services companies that are advancing during a period of little investor interest in an otherwise dull energy market. Not a sheep in sight – could be time cut your favourite energy stock from the herd
Friday, August 7, 2009
GT Blog August 7, 2009
Technical Analysis – myths and urban legends continued…
The implication that a stop loss strategy is for amateur investors who lack the education to understand a company’s financial statement or to dissect an earnings release is voodoo analysis. In fact any portfolio manager or CFA, CA, CIM or whatever who issues a public buy recommendation without a protective selling strategy should carry the following designation after their name - IDIOT
The biggest offender in the public recommendations game is BNN’s Market Call where on a daily basis the talking heads issue buy recommendations and never tell the viewers when to sell.
Did you buy the shares of Timminco Limited (TSX-TIM) last $1.39 when on May 27, 2008 Jean-Francois Tardif commented on his past top pick TOP PICK Timminco @ $24.05 (A Top Pick Aug 7/07. Up 238%.) “Think they can have 30,000 more tons of production. Still has confidence in this one.”
Then on July 7, 2008 with Timminco @ $27.90 Tardif is quoted (Market Call Minute) “HOLD Potential is still to come. (source stockchase.com)
I never got a call from this guy when he sold – did you?
On August 14, 2008 Michael Spring recommended Crescent Point @ $37, Sun Life @ $39.90 and Thomson Reuters @ 37.10 all without stops because he does not use technical analysis
On August 5, 2008 Peter Brieger recommended CDN Natural Res @ $75, Agrium @ $82.78 and Deere & Co @ $66.67 all without stops because he is not a technical analyst
Just to review – according to Investopedia on stops - Setting a stop-loss order for 10% below the price you paid for the stock will limit your loss to 10%. This strategy allows investors to determine their loss limit in advance, preventing emotional decision-making
So here is the tragic reality of failing to protect the downside – as an individual investor yes, you may be in for the long term but, you may be forced to sell if your circumstances change at the wrong time in the stock market cycle. Your forced sale losses at bear market lows could ruin your life. The talking heads on TV don’t have to sell – it isn’t their dough. So they can hold on through the peaks and valleys – they still get paid to wait – you on the other hand, do not
The table below sets out the above buy recommendation dates and price along with the subsequent bear market lows. Note the horrific potential losses if you had to sell at the low. The same six stock picks are listed with stops set at a simple trailing lowest low of 10-weeks ago – a 10-week low price channel – now the big surprise – four of them broke down before the buy recommendations – they were already road kill

Wednesday, August 5, 2009
GT Blog August 4, 2009
Technical Analysis – myths and urban legends continued…
The use of daily charts along with the popular MACD may be suitable for traders but for investors it is a bad idea because the daily chart can mislead and the MACD is over-used by too many investors and traders
The chart below seems to be flashing a buy signal as the stock holds at support and the MACD signal line is about to cross the slower MACD line – note also the histogram is bottoming – so all-in-all a perfect opportunity for a buy under $15 and a sell at the upper trend line in the high $16 range
Now that is OK for a trade but technically Biovail is not a suitable investment as we will see when we look at the longer term chart
Biovail – a perfect trade?
Below is the longer term monthly chart which displays a stock in a long term down trend as set out on the declining parallel price channel trend lines - note the last MACD buy signal back in mid 2008 along with the current histogram beginning to flatten - Biovail is currently at the top of the longer tern trading range and so is not the screaming buy as displayed in the short term daily chart - clearly one must always look at the longer term trends before acting and remember to use a semi-log scale on those long term charts
Biovail - a not so perfect investment
Biovail - a not so perfect investment
Wednesday, July 29, 2009
GT- BLOG JULY 29/09
Technical Analysis – myths and urban legends continued…
Sometimes when we all know something to be true - the opportunity for profit is lost in the crowd - In other words if we all know - who is left as a bag holder?
To-day many intelligent and experienced money managers believe the U.S. dollar is in a long term decline vs. all the major currencies. They protect their portfolios with bullion ETFs and precious metal stocks such as Barrick, Goldcorp, Kinross and whatever.
The attraction for the gold stocks is the leverage because if bullion were to ever break firmly above $1000 - the gold stocks will fly
Then again - maybe not.
Our long term chart of gold stocks vs. bullion illustrates the three stages of the stock/bullion relationship. The first stage is the gold stock out-perform stage at (A) 2001-2003 when the gold stocks out performed bullion - this was the "recognition of survival" stage. The second stage at (B) 2004-2007 is the earnings stage when earnings kept pace with the rising bullion prices.
The third and final stage is at (C) 2008 to date when the gold stocks under- perform the price of bullion because of rising costs, political and environmental issues. Best just to own the bullion - by the way - the energy stocks have the same problem 
Sometimes when we all know something to be true - the opportunity for profit is lost in the crowd - In other words if we all know - who is left as a bag holder?
To-day many intelligent and experienced money managers believe the U.S. dollar is in a long term decline vs. all the major currencies. They protect their portfolios with bullion ETFs and precious metal stocks such as Barrick, Goldcorp, Kinross and whatever.
The attraction for the gold stocks is the leverage because if bullion were to ever break firmly above $1000 - the gold stocks will fly
Then again - maybe not.
Our long term chart of gold stocks vs. bullion illustrates the three stages of the stock/bullion relationship. The first stage is the gold stock out-perform stage at (A) 2001-2003 when the gold stocks out performed bullion - this was the "recognition of survival" stage. The second stage at (B) 2004-2007 is the earnings stage when earnings kept pace with the rising bullion prices.
The third and final stage is at (C) 2008 to date when the gold stocks under- perform the price of bullion because of rising costs, political and environmental issues. Best just to own the bullion - by the way - the energy stocks have the same problem
Wednesday, July 22, 2009
GT Blog July 21, 2009
Technical Analysis – myths and urban legends continued…
Today we look at the dreaded Key Reversal – yes the inexperienced analyst will often recommend a sale based on this over-used reversal pattern
According to stockcharts.com “Key Reversal Day: A one day chart pattern where prices sharply reverse during a trend. In an uptrend, prices open in new highs and then close below the previous day's closing price. In a downtrend, prices open lower and then close higher. The wider the price range on the key reversal day and the heavier the volume, the greater the odds that a reversal is taking place.
I have found that on daily charts – the key reversal is just noise and in most cases the trend is not interrupted – take a look at the daily chart of SNC – Lavalin Group Inc the 10 key reversals are marked with a red dot

The experienced technician will use other trend following tools such as trend lines and simple moving averages – more complex studies such as relative performance and money flow will also confirm the advance or decline
Friday, July 17, 2009
GT Blog July 17, 2009
Technical Analysis – myths and urban legends continued…
A few days ago I looked at one of the most over-used and misinterpreted patterns - the scary Head & Shoulders Reversal pattern
Another over-used technical tool is the 50 day and 200 day crossover – the idea here is to buy if the 50 crosses above the 200 (the golden cross) and to sell if the 50 crosses below the 200 (the death cross) – Well I did a scan of 100 of the top TSX big caps and then did a scan of all of the major stock indices to see if the buy & sell signals worked
The scan covered long and short trades – and found the batting average overall was less than 50 % meaning that profitable trades will on average occur four times out of ten trades – but in a trending markets the profitable longs or shorts more than covered the losses on the whipsaw losing trades.
As you can see the 10-year batting average for the TSX Composite was 40% which means an investor cannot “blow out” an entire portfolio on a sell signal and then re-acquire on a buy signal – a more practical approach would be to use one trade per signal and put on or take off an insurance product such as and inverse ETF such as the TSX listed HIX or the HXD – for more info visit http://www.hbpetfs.com/index2.asp
Tuesday, July 14, 2009
GT Blog July 14, 2009
I was channel flipping and caught business TV call-in question on the Head & Shoulders top on the S&P500 and I wondered what in the hell was the caller talking about. To my great surprise the host technical analyst admitted to be concerned about the bearish implications – the chart below displays the pattern in question
The Scary Head & Shoulders Reversal pattern in the S&P500


The Scary Head & Shoulders Reversal pattern in the S&P500
My concern here is the improper use of technical analysis which often results in the profession being referred to as “Voodoo Science”
First of all the pattern above is too small at 8 weeks to be important – if you look closely the up trend was violated in early June just to the right of the head and so we have completed a small A-B-C correction – that means the small H&S pattern is late and too small to even act. Are you really going to blow out a portfolio because of a series of small little bumps?
To be meaningful the H&S pattern has to be big - at least 8-months – sometimes 8-years because a true H&S top can only be seen in weekly or monthly charts which most investors and technicians seldom use. The large H&S reversal will usually signal an end to a business enterprise – or signal an important change in the related industry which in the case of the FNM chart below an early signal of trouble ahead for the US housing industry How many investors and professionals saw this deadly pattern? Very few – and you know why?
Why because no one gives a crap about the long term forces at work – we only care about last week and the outlook for next week – we all want to make a fast buck just like those US financial engineers who got us into this mess
Fanny Mae – a real top
Fanny Mae – a real top
Saturday, July 11, 2009
GT_ JULY 11/2009
This was an entertaining item in the Globe Report on Business last week – readers were invited to direct questions on the capital markets to an “expert” - I believe header was “Ask Dennis Gartman “ or ask an expert who lives in a foreign country
Here is a clip (with the typos)
Vaidyisa Bala writes: What are some of the best dividend growth stocks in Canda for long term (5 to 10 years ) investment you recommend? This could be in any stable sector.
Dennis Gartman: Dividend stocks for 5-10 years? I’d say probably the same dividend stocks that were good for the past 5-10 years, which is none. I’ve no ability to look out 5-10 years, and anyone who tells you they can is a charlatan and/or foolish. Perhaps a year or so is reasonable, and to that end I’d buy raw materials manufacturers and miners: steel; copper; zinc; grain growers; water… these are where I’d put my money… with stops on everything.
WOW – this guy really ignores the question – the answer is flippant and furthermore Gartman knows little of Canadian equity history – but we need to check out his story
Below is a long term chart of the TSX Financial (dividend paying) Index – note the relatively smooth returns from 1990 to 2007 – the 2008 collapse and subsequent recovery was a global event – in answer to the question a stable group

Below a long term chart of Canada’s Metal Mines – not a stable group and clearly not relative to the question because of the volatility and unpredictable returns
From 1991 to 2003 basically dead money – no income just nothing but lost opportunity to be in places like financials, technology consumer – now look at the big gains from 2004 to 2007 and then once again dead and volatile money from the 2007 peak to date
From 1991 to 2003 basically dead money – no income just nothing but lost opportunity to be in places like financials, technology consumer – now look at the big gains from 2004 to 2007 and then once again dead and volatile money from the 2007 peak to date

So Gartman would buy raw materials manufacturers and miners: steel; copper; zinc; grain growers; water OK great what are these names? Aside from the miners what are the great names in grain growers and water?
The only asset left is a hole in Saskatchewan - Potash Corporation of Saskatchewan which at its manic peak was worth more than Canada largest bank and RIM – can we now even think of Potash as a reasonable investment for our investor who seeks the safety of “stable dividend growth”?
The only asset left is a hole in Saskatchewan - Potash Corporation of Saskatchewan which at its manic peak was worth more than Canada largest bank and RIM – can we now even think of Potash as a reasonable investment for our investor who seeks the safety of “stable dividend growth”?
Monday, July 6, 2009
GT Blog July 05, 2009
A few comments on the dreaded torpedo stock
Last week I was a guest on BNN’s Market Call and I believe I gave a hurried and insensitive answer to a question regarding the collapse of OPTI Canada Inc. (TSX-OPC)
There are a lot of callers and so there is pressure to hurry but that is no excuse and I regret glossing over a significant event that inflicted harm on many investors - OPTI is a torpedo stock and so here is how I learned who to deal with a torpedo
There is no protection from the torpedo – it ambushes the fundamental and technical guys – to include the pros and the private investors. That means that stops do not work and there are no warnings in the balance sheet.
I get stuck with a torpedo in August 2004 when CP Ships released its second quarter 2004 financial results restating previously reported financial results – apparently a new SAP financial accounting system in January when implemented revealed some deficiencies in former systems - CP tanked – so - first of all do nothing – no buying or selling because the sudden drop or torpedo is usually the only drop BUT - the stock needs time to “heal” so just wait it out for at least 26 weeks – in the case of CP Ships a year later the stock was taken out by German conglomerate TUI AG at $27


Friday, July 3, 2009
For GT Blog July 02, 2009
I hope many of you enjoyed the great March – June advance in the world equity markets. OK so now we go through a period of confusion as the market has to answer some legitimate questions
Is this a bear market rally? Will we have a re-test of the October-March lows? Then again perhaps this a bull market and we should hang in there for more highs, Perhaps you sold in May and went away with a view to buy back in the fall – well I think we have a new bull but I also think reducing here is a good idea – but – reduce what?
I would reduce a group of stocks that ALL of the experts love to own. This group gets more business press than all other stock groups combined – this stock group is a Canadian champion – this is a must-own group
Well the group is energy – yes I would bail out of these oil stocks now – especially the tar sands participants – look at the chart – clearly the stocks are not responding to any rise in crude prices – a bad omen – what happens if crude falls?
Crude vs the SPDR Energy ETF – (XLE) – US dollars
Thursday, June 25, 2009
GT Blog June 25, 2009
An interesting item in the Globe Report on Business today - Number Cruncher - Steve Ladurantaye produced a list of TSX listed issuers with high cash positions. The implications here is that lots of cash is a good thing because of the possibility of increased dividends and or share buybacks. Onex is apparently sitting on a cash hoard of about $18 per share so at the current $20 you only pay $2 for all of their operating enterprises
Other cash rich issuers are Fairfax Fin, Celestica, Transat AT, Aecon, AGF Mgt, Westjet, Atco, BMO, Sun Life, Manulife, Hudbay, Power Corp and Magna
Now before you even think about buying these gems you have to ask - why all the cash? I have found that cash rich companies can be poor investments because too much cash relative to the working assets can be a sign of a dying company that investors are using as a piggy bank
Share buy-backs are a good way for shareholders to loot the treasury
I once thought of Onex to be a growth company - and now I am not too sure - so here is the acid test - if over the next few months management puts the cash to work growing the company I want to own the stock - if management does a share buyback run away and let the stock languish for another ten years
To Grow or to shrink - that is the question 
Other cash rich issuers are Fairfax Fin, Celestica, Transat AT, Aecon, AGF Mgt, Westjet, Atco, BMO, Sun Life, Manulife, Hudbay, Power Corp and Magna
Now before you even think about buying these gems you have to ask - why all the cash? I have found that cash rich companies can be poor investments because too much cash relative to the working assets can be a sign of a dying company that investors are using as a piggy bank
Share buy-backs are a good way for shareholders to loot the treasury
I once thought of Onex to be a growth company - and now I am not too sure - so here is the acid test - if over the next few months management puts the cash to work growing the company I want to own the stock - if management does a share buyback run away and let the stock languish for another ten years
To Grow or to shrink - that is the question
Sunday, June 21, 2009
For GT Blog June 19, 2009
Let’s listen on a broker advisor & client conversation
Client: How come we are still sitting in cash when the market has been going up since early March? I recall your slogan is to buy-hold and sell, and know when to buy again.
Broker advisor: Our models tell us this a bear market rally and that we will correct down to re-test those March lows because there is no leadership to sustain the advance.
Client: No leadership? How come the Nasdaq is up 50% from the March lows?
The client remembers when the North American tech sectors had a big growth spurt through the 1990's with the group building an exponential price spike in early 2000. The prime driver was the spending boom stimulated by the Y2K fiasco. Remember when all tech driven devices were to stop at New Years Eve 1999? PC's were to explode and planes would fall from the sky.
What we did get was the great 2000 - 2002 Granddaddy bear that introduced a secular down trend in the technology sector which is still in place. Nortel stunk up the space and investors moved on to the income trust sector only to get burned again. Now we all want to own energy and potash stocks - the ownership of tech stocks is just not fashionable
Keep in mind the rules of a secular down trend - the secular down trend will have at least 3- bull and bear cycles and one of then (usually the first ) will be a Granddaddy - now we are just into cycle 3 and this could mark the end of the long down trend with a surprise to the upside in 2009-2010
Note the three bears of Cisco and Texas Instruments - these sleeping giants will soon awake and catch many by surprise - remember it is buy-hold, know when to sell and know when to buy again. 
Client: How come we are still sitting in cash when the market has been going up since early March? I recall your slogan is to buy-hold and sell, and know when to buy again.
Broker advisor: Our models tell us this a bear market rally and that we will correct down to re-test those March lows because there is no leadership to sustain the advance.
Client: No leadership? How come the Nasdaq is up 50% from the March lows?
The client remembers when the North American tech sectors had a big growth spurt through the 1990's with the group building an exponential price spike in early 2000. The prime driver was the spending boom stimulated by the Y2K fiasco. Remember when all tech driven devices were to stop at New Years Eve 1999? PC's were to explode and planes would fall from the sky.
What we did get was the great 2000 - 2002 Granddaddy bear that introduced a secular down trend in the technology sector which is still in place. Nortel stunk up the space and investors moved on to the income trust sector only to get burned again. Now we all want to own energy and potash stocks - the ownership of tech stocks is just not fashionable
Keep in mind the rules of a secular down trend - the secular down trend will have at least 3- bull and bear cycles and one of then (usually the first ) will be a Granddaddy - now we are just into cycle 3 and this could mark the end of the long down trend with a surprise to the upside in 2009-2010
Note the three bears of Cisco and Texas Instruments - these sleeping giants will soon awake and catch many by surprise - remember it is buy-hold, know when to sell and know when to buy again.
Wednesday, June 17, 2009
For GT Blog June 17, 2009
One blog ago I promised to provide a list of small cap technology names that may generate a surprise recovery through 2009-2010
Unfortunately the recent down days have sent me back to the chart room to write a stock filter that will select stocks displaying strength during a period of general weakness
The filter had several arguments or if-than-else conditions
The closing volume had to be greater than the average 10-day volume
The close had to be greater than the previous high
The price had to be greater than $2.25
The closing volume had to be greater than 250000 shares
There were only 16 names selected from the Canadian data base of about 1100 names and there appeared to be a slight common theme along with a few surprises
Here goes and pardon the lack of detail – its late and I am tired
ACE Aviation, Agnico Eagle, Groupe Aeroplan, Cogeco Cable, Labopharm, EPCOR Power, Jazz Air Income, Kinross Gold, Livingston Int’l, Magna Int’l, Novagold Res, New Gold Inc, Petro Andina Res, Pembina Pipe, Sherritt and Sino Forest
Disclosure – Getting Technical is long the shares of New Gold Inc. 
Unfortunately the recent down days have sent me back to the chart room to write a stock filter that will select stocks displaying strength during a period of general weakness
The filter had several arguments or if-than-else conditions
The closing volume had to be greater than the average 10-day volume
The close had to be greater than the previous high
The price had to be greater than $2.25
The closing volume had to be greater than 250000 shares
There were only 16 names selected from the Canadian data base of about 1100 names and there appeared to be a slight common theme along with a few surprises
Here goes and pardon the lack of detail – its late and I am tired
ACE Aviation, Agnico Eagle, Groupe Aeroplan, Cogeco Cable, Labopharm, EPCOR Power, Jazz Air Income, Kinross Gold, Livingston Int’l, Magna Int’l, Novagold Res, New Gold Inc, Petro Andina Res, Pembina Pipe, Sherritt and Sino Forest
Disclosure – Getting Technical is long the shares of New Gold Inc.
Thursday, June 11, 2009
For GT Blog June 12, 2009
Let’s listen in on a broker client conversation
Broker (investment advisor): The technology stocks are getting really strong
Client: How strong are they?
Broker: They are so strong even the Mavrix Strategic Small Cap Fund is up this year
Client: Wow – that is really strong - I see the Mavrix Fund Management shares (TSX-MVX) have bounced up to 24 cents and they may be added to the BNN stock ticker just like Allen-Vanguard Corporation (TSX-VRS)
Now for some reality – we at Getting Technical examined the cyclic structure of the TSX Information Technology index and were confronted with a strong bullish scenario. Following a decade of growth in the 1990's the group peaked in 2000 and the great 2000 - 2002 Granddaddy bear introduced a secular down trend which is still in place.
The rules of a secular trend look good for the sector - the secular down trend will have at least 3- bull and bear cycles and one of them (usually the first ) will be a Granddaddy - now we are just into cycle 3 and this could mark the end of the long down trend with a surprise to the upside in 2009-2010 - next blog we look at some small cap tech names
Subscribe to:
Posts (Atom)


