Thursday, December 22, 2011

Tax Loss Selling in Bear Market Years

This strategy is particularly intense during the during bear market years as investors and portfolio managers lock in capital losses for the current trading year. A portfolio manager will engage in tax loss selling to ensure the overall portfolio does not attract a taxable gain in the event of a small per cent of profitable positions.

Important Dates for 2011

Canadian exchanges are closed Dec 26 & 27, 2011.  In order to have a sale transaction settle within the 2011 calendar year in Canada, sell orders must be filled on Dec 23rd 2011 for Canadian exchanges. The NYSE is open on the 27th which would be last day for selling in order to settle on Dec 30th.

Any issuer sold cannot be bought back within 30 days, or it will not count as a capital loss. Consider buying a similar investment if you wish to retain exposure to the related sector such as metals, energy or the financials. As an example, if you sold Kinross Gold Corp at a loss you could buy IAMGOLD Corp on the same day. You would be trading a distressed gold stock for another distressed gold stock. If you had a basket of gold stocks to sell you could buy a gold stock related ETF such as the iShares S&P/TSX Global Gold Index Fund (XGD)  

IMPORANT: This group has historically printed a significant rally in the first week of the following January. The basket below could produce a one-week return of 15% 

Tax Loss Selling Rebound Candidates      14-Dec11

Stocks under $1 and a volume of less than 30,000 are removed


Company                     Symbol Price                Volume

Friday, December 16, 2011

Gold do we hold or fold?

On my last post I told the gold bulls to cheer up because the worst may be over because the generally bullish Dennis Gartman said he expects the yellow metal to fall to $1,450 an ounce before it breaches $1,800 and Gartman has fully closed his gold position. Since Dec 12 gold has dropped from 1666 to 1575 and so we need to take a look at the technical picture.

Our chart today is the daily closes of the NYMEX gold plotted above the AMEX Gold Bugs Index. So far this looks like a simple A-B-C type correction in both plots. Currently there is a small degree of bullish positive divergence with the AMEX Gold Bugs printing a higher corrective wave low (C) relative to corrective wave low (A). We need these lows to hold in order to avoid a (C) wave extension. When you look at a very long term weekly or monthly gold chart the primary up trend line has not been violated.  

Tuesday, December 13, 2011

The Gartman Track Record

Gold bulls cheer up, the worst may be over. I just found this on Forbes.com 12/12/2011 @ 2:00PM. “Gold prices continue to tumble in the face of a stronger dollar, prompting the generally bullish Dennis Gartman to say he expects the yellow metal to fall to $1,450 an ounce before it breaches $1,800.  Gartman has fully closed his gold position.”

According to Horizons Exchange Traded Funds. The Horizons Gartman ETF (TSX-HAG) gives investors direct exposure to the investment strategies of The Gartman Letter. They go on to say Dennis Gartman likely doesn’t need any introductions. Author of The Gartman Letter a highly regarded daily macro-economic and trading-oriented newsletter which is read by the investment community including leading global banks, brokerage firms, hedge funds, mutual funds and commodity trading companies

Gartman is a perfect contrarian indicator - look at his “real money” track record. From inception March 26, 2009 (that is when the global equity markets bottomed) the HAG is down 23% or negative 9.21% annualized. The bid at the close Dec 12, 2011 @ $7.65 would be another new 52-week low.

Our chart today is the daily closes of the HAG plotted above the TSX60 Index. The relative perform vs. the TSX60 is “disturbing”. Note the position of the 10 & 30 week MA with the 10 week for the most part below the 30 week MA over a 140 week period. That is a down trend. Go figure.

Thursday, December 8, 2011

Is it a Bull or a Bear?

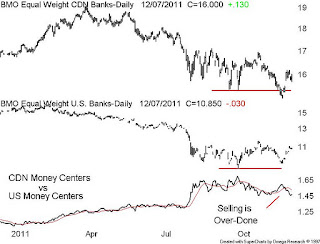
The big technical question right now is; are we in the early stages of a new bull market or are we about to print another leg down in the global bear that has operating since April 2011?

As technicians we need to know the dominant North American sectors – in the U.S. they are financials, technology and the industrials. In Canada the dominant sectors are financials, energy and materials. Note one common sector, the financials. This should be of no surprise because there has been no modern bull market that has operated without participation or leadership of the financials. If you know of one, let me know

Our chart today is the daily closes of the CDN bank sector plotted above the U.S. bank sector. Note that our healthier CDN banks briefly traded below their Sept-Oct lows while the “riskier” U.S. money center banks did not confirm the CDN bank breakdown. I blame the selling in the CDN banks on those young and inexperienced portfolio managers who watch too much business television. I believe we are in the early stages of a great new bull market and our CDN banks are a buy at these levels. If I am wrong I will convert to the temple of noted bear and economist David Rosenberg.

Tuesday, December 6, 2011

Canadian Securities Institute Item Jan 2006

Good educational value - this is a clip - Technical analysis is the best way to determine the trend. The most common tools are trend lines and moving averages.

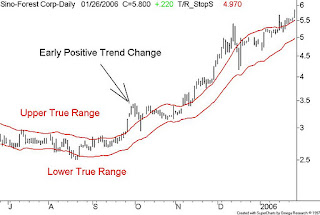
Some time ago I adopted a modified version of the "True Range" to determine the trend because the same system can also be used to set trailing stop loss settings.The original True Range was described in 40 year old publication by J. Welles Wilder Jr. entitled New Concept in Technical Trading Systems, When the True Range bands are applied to Tembec Inc. we can easily see the trend 

When the True Range bands are applied to Sino Forest Inc. we can easily see the trend


The technical rule is simple; do not buy anything in a down trend no matter what anybody says - period.

The formula:

The true range is: the absolute value of the largest of the following – (I use weekly data) 

·         Distance between today’s high and today’s low

·         Distance between today’s high and yesterday's close

·         Distance between today’s low and yesterday’s close

Once you have the true range, you then calculate the upper and lower bands.

The upper band is the trading HIGH plus the TRUE RANGE. (10 period smoothing)

The lower band is the trading LOW minus the TRUE RANGE. (10 period smoothing)

Bill Carrigan