Monday, December 30, 2013

Semi-log vs. Linear scale charting:


Why do you always use a semi-log scale in your charts? This is a question I always get during a teaching session. Usually the students are industry pros who surprisingly are not clear on the choice between a linear or semi-log (percent) scale.

The old rule among technical analysts used to be if the data doubles use a semi-log scale but now many will use a 50% price range before the switch from linear to semi-log. I always use a semi-log - see the Air Canada chart example.

On the lower linear scale it appears the advance at B is greater than the advance at A which is not true. The above semi log clearly displays the A & B advances to be about equal in price change. Also never draw trend lines on a linear scale. This is a common error even among CMT’s that should know better.


Tuesday, December 24, 2013

Non confirmation of the NYSE advance / decline line:


Just to review a clip from the Getting Technical market letter - Interim Update December 4, 2013 GT1417 – page 2 – “A Probable Short Trading Correction”

“The Advance / Decline Line (AD line) is one of the most widely used indicators to measure the breadth of a stock market advance or decline. The AD line tracks the net difference between advancing and declining issues. It is usually compared to a market average where divergence from that average would be an early indication of a possible trend reversal.

Clearly that observation was 20 days ago – and now here we are with the S&P500 at all time highs and the NYSE A/D line (see chart) still not confirming the recent advance. This is a sign of thinning leadership.  Reducing into the current bullish stampede may be prudent.


Thursday, December 19, 2013

Selling into strength


Yesterday’s big rally on the Dow to 16167.97 - UP 292.71 points or 1.84% was a new record high. The Dow is also up 146.95% from its Bear low of 6547.05 hit 3/9/2009. The S&P500 also closed at a new all-time high – but the NYSE advance / decline line did not confirm the current bullish stampede. I will display a chart – next post.

Here at GT we are selling our CDN Multi-National selections of April 26, 2012 that has returned about 63% to date. A clip from a Getting Technical letter Interim Update December 18, 2013 GT1419 TSX Comp 13335 DJII 16168 – “Cyclic peaks in many Stock sectors suggest we sell into the current period of seasonal strength.”

And:

“Canadian Multi-Nationals - We take advantage of the current bullish stampede into equities. It has been a great 20-month run but with all components at long and intermediate term cyclic peaks - we liquidate all positions - only laggard Bombardier could be retained. The final returns will be based at the close of December 24, 2013


Friday, December 13, 2013

I bought a gold stock yesterday:


There is a difference between trading and investing. For trading I don’t usually buy gold stocks because I think you get more opportunities in the small cap technology and health science names,

However yesterdays price behaviour in the CME Feb gold contact and the price behaviour in many of the gold miners was a compelling divergence signal. The metal was down sharply and yet many of the miners were about to close up on the day. I bought some B2Gold Corp. (BTO) just before the close at $2.15 for several technical reasons. The weekly chart (I rarely use dailies) displays several positive technical signals – first of which is the higher weekly price and the double bottom. We also have an intermediate cycle trough and the money flow numbers – while not compelling did not break down. If the price posts a daily close under the lowest low of 10-weeks ago ($1.98) I am gone.


Wednesday, December 11, 2013

A trading top in the NYSE advance / decline line:


A clip from the Getting Technical market letter - Interim Update December 4, 2013 GT1417 – page 2 – “A Probable Short Trading Correction”

“The Advance / Decline Line (AD line) is one of the most widely used indicators to measure the breadth of a stock market advance or decline. The AD line tracks the net difference between advancing and declining issues. It is usually compared to a market average where divergence from that average would be an early indication of a possible trend reversal. The upper plot (see chart) is the S&P500 and the lower plot is the NYSE A/D line. Some worry now as the A/D Line is just now breaking DOWN below the resistance peaks of May, July and Sept.”

Summary: This is a trading call and should be ignored by longer term investors.
Note the S&P500 close of 1795 on the December 3, 2013 chart and at the close today the S&P500 was 1782. If that lower trend line is extended through year-end the downside target is only about 1750. That is not a lot of downside but just enough to scare Santa away this year.


Saturday, December 7, 2013

Riding the Natural gas bull:


A clip from the Getting Technical market letter - Interim Update December 6, 2013 on natural gas: “Colder weather helped raise the price of the front-month natural gas futures contract, which has increased on ten consecutive trading days from November 19 to December 4. This has pushed near CME contract above the February through June 2014 contracts suggesting a short term over-bought condition. However, demand for natural gas could become significantly higher in December and January, when natural gas demand for residential and commercial heating increases. In any event – money is flowing into the natural gas producers – we should have some exposure” (see selections)

How not to play the natural gas bull: According the Horizons, “The Investment Objective of The Horizons BetaPro NYMEX Natural Gas Bull+ ETF (HNU) and the Horizons BetaPro NYMEX Natural Gas Bear+ ETF seek daily investment results equal to 200% the daily performance, or inverse daily performance, of the NYMEX Natural Gas futures contract for the next delivery month. The HBP NYMEX Natural Gas Bull+ and Bear+ ETFs are denominated in Canadian dollars, as the US dollar exposure of the underlying index is hedged daily.” (All that work for a management fee of just 1.15%).

Our natural gas vs. HNU chart sets out the returns from the Feb 17, 2012 peak to date with the upper plot up by 44% and the lower plot down by 41%

YTD through October the HNU has returned a negative (20.6%). The continual NYMEX Natural Gas contract has returned a positive 6% and the equity related BMO Junior Gas Index ETF (ZJN) has returned a positive 37%.

How to play the natural gas bull: If you’re bullish on the outlook for natural gas go with the BMO ZJN or do some stock picking among a basket of the gassy producers.


Friday, November 29, 2013

Fairfax Financial is confusing the experts:


Over the past several days I had many questions on the outlook for the price direction of the Canadian bank stocks. So here is the technical opinion based on my work.

First, there is great cyclic commonality among all of the big five banks and so we have a monkey-see, monkey-do situation. Secondly all of the banks are trading too far above their respective 50-day simple moving averages as measured in historical terms. Third all are trading above their respective rising 200-day simple moving average. Fourth is the peaking momentum studies and finally all have posted recent new 52-week highs.

So a reasonable strategy would be for long investors to reduce because the group is likely to correct down to their respective 50-day moving averages BUT retain some exposure as the banks will likely resume the upward trend which remains in place as evidenced by their rising 200-day (or 40-week) moving averages along with the recent string of new 52-week highs. The ultimate top is not yet apparent and so the bull market in most of the financial sector remains in place – except for Fairfax Financial Holdings Limited (FFH) which closed today at $405.00

According to the company Fairfax is a financial services holding company which, through its subsidiaries, is engaged in property and casualty insurance and reinsurance and investment management.

The experts are divided on the outlook for FFH as published on the Stockchase.com web site. According to Stockchase.com, “This site is used by investors to track what stock experts say. It is useful as an online investing tool for due diligence, and for getting a feel for how companies are thought of by investment experts. This site should not be your only resource or reference, but it should be one of the investing tools in your arsenal for wise investing in the stock market.”

Some recent opinions:

Hank Cunningham 2013-07-17 DON’T BUY on FFH then $422.00: “How comfortable should a person be in investing in this companies debt, dated 2020 to 2022? He would not be very relaxed as he is not very comfortable with companies that he doesn’t understand. He doesn’t understand their balance sheet or their strategy. It is a fluid situation and this is a long-term corporate bond with a rating of BBB minus, not strong credit.”

Barry Schwartz 2013-10-09 BUY on FFH then $435.50. “He owns a series of rate reset shares.  If they are trading below $25 then the market thinks they won’t be called.  They are fairly illiquid.  They have not recovered since the announcement of tapering and may be a good investment.”

Don Vialoux 2013-10-11 BUY on FFH then $440.60. “One of the more volatile financial services company in Canada. Chart shows a nice breakout over a long period of time, which is very positive. Trading above its 20 day moving average and is outperforming the TSE. This gives it a technical score of 3. Looks very interesting.

Cunningham is a fixed income guy who does not do technicals. Schwartz is a fundamental value guy who hates technicals and Vialoux is clearly voicing a technical opinion.

When I look at chart #1 which is a weekly plot of FFH displaying poor relative strength vs. its peers the TSX Financial index – in this case the clone XFN, Note the 2+ years of relative under perform. Clearly FFH has missed the greatest financial bull since the 1990’s. The recent collapse is very negative – see the money flow on chart #2


When I look at chart #2 which is a monthly plot, I see a string of cycle magnitude failures from 2009 and recent declining money flow numbers. I think Cunningham has made the correct call on this one.


Monday, November 25, 2013

Gold and the A-B-C Correction:


In a Getting Technical Interim Update November 21, 2013 GT1416 on page 4 - I commented on the precious metals complex.

“Watch the large gold miners The larger gold producers dominate the TSX Materials Sector by weight and the performance is displayed on the Weekly MOM Table on page 3. The TSX Materials sector is currently a # 12 rank on the long term monthly rotation MOM Canadian table. Note Barrick Gold (ABX) and Goldcorp (G) are so far - holding at or above their important June and July 2013 lows.

Strategy: hold on to current positions in the gold complex – but do not add-on in here
Bullion – The long term trend in bullion is still up as displayed in the 15 + year plot to the left (insert). Currently the 12-year primary trend line is at the $1200 dollar level. This important level was tested during the (C) corrective wave low of June 2013 when bullion bottomed at $1183.
The current wave of selling should not violate the June 2013 lows – see support from the major producers (above).


Saturday, November 16, 2013

Market Breadth & the 52 week high/low line


I have devoted several posts to detail the importance of using the new 52-week high / low list as a strategy to screen stocks for buy or sell candidates. The new 52-week high / low list can also be used to measure the strength of the prevailing trend.

For example in the NYSE at the close Friday November 15 we had 380 new 52-week highs and only 30 new 52-week lows. During a bear trend the new 52-week high / low list would be reversed new 52-week lows outnumbering the new 52-week highs.

When used as a breadth study we need more than one good day but rather a long series of stocks making new highs. The best approach is to study the cumulative total of new highs less the new lows. This is not the same study of the popular AD line that tracks the net difference between the DAILY advancing and declining issues.

The chart is a weekly of the S&P500 plotted above the weekly cumulative 52-week hi/lo line which smoothed by a 20 period simple moving average. I have marked the two sell and two buy signals issued over the past seven years. When I get a sell signal – you will be the first to know.


Wednesday, November 13, 2013

Buy and Hold in the Real World:


More on why buy & hold depends on what you buy and hold.

On a previous post I reviewed the April 2012 the Getting Technical market letter Canadian Multi-Nationals Buy & Hold portfolio which over the long term was to outperform the broader stock indices. At the close November 8, 2013 the selections returned 62% outpacing the TSX Composite and the S&P500 by a wide margin.

The Canadian Multi-Nationals Buy & Hold portfolio was selected using only technical analysis as a tool for portfolio construction and maintenance. This is the flip side of technical analysis being associated with speculative market timing and day-trading.

Strategic Planner, Jack Di Nardo of Wealthworks Financial sent me his latest Client Bulletin - November 2013 (Investing vs. Trading) and I quote a portion:

“Trading, which most people confuse with investing, includes any methodology that takes its cues from the price action of various markets, such as, technical trading, day-trading, and momentum (earnings, price or volatility amongst others) trading or buying on rumours because your friends insist the price of the stock is going to go up!

There are basically only three broad methodologies used for selecting individual companies with everything else being a variation upon these. They are value-based, growth-based or growth at a reasonable price (GARP) based security selection. But at the end of the day they are all dependent upon expected profit (and economic) growth over time.”

It appears Jack is claiming technical analysis is for speculative trading and not for use in portfolio construction and maintenance.

I am sure many technical analysts would not agree with Jack’s opinion because many of us have and currently use technical analysis for portfolio construction and maintenance.

A good “real money” example was the Union Securities Hybrid Investment Program, managed in a discretionary manner by a registered portfolio manager (PM) using both "fundamental" and "technical" analytical tools to select securities. The PM and Getting Technical Info Services (GT) would split the Hybrid Portfolio with about one half of the portfolio being fundamental (PM) selections and the other half being technical (GT) selections.

The Union Securities Hybrid Investment Program was closed in mid 2012 when in October 2012; all of Union’s client accounts and assets were transferred to another IIROC Dealer Member.

I did however track an original “Mandate #4” Hybrid portfolio beginning with all the equity components at November 9, 2011 and hypothetically held through to November 12, 2013. The Union Hybrid Mandate #4 program was in the aggressive growth category that allowed up to an 80% exposure to equities and 20% to fixed income.

Summary of Returns; November 9, 2011 through to November 12, 2013.

Our benchmark The TSX Composite had a 2 Year capital return of +9% over the study period.
 
There were 12 fundamental selections with a 2 Year capital return of -8 %, see table #1

Table #1


The fundamental (PM) would have done OK except for two problems that seem to be common in many fundamental methodologies. Our PM was drawn into a value trap (RIM or BlackBerry) and our PM was caught in the need-to-own-gold as a hedge trap.

I can tell you that in the world of money management, when new investors entered into the Hybrid program they were placed into the same fundamental selections as the earlier investors. So late comers paid more for units of the stronger positions and they paid less for units of the weaker positions.


We know through the study period about one third of the selections were declining and so in this situation the newer investors did better (or lost less) than the older investors.

There were 15 technical selections with a 2 Year capital return of + 32% see table #2

Table #2


Observations:

The technical (GT) selections did well by avoiding the compelling stories that can put a positive fundamental spin on the wrong stock at the wrong time.

All of the GT selections were based on technical conditions such as long bases, improving relative performance and rising long term moving averages.

Once again new investors to the Hybrid program were placed into the same technical selections as the earlier investors. So as late comers they paid more for units of the stronger positions and they paid less for units of the weaker positions.

We know through the study period most of the selections were advancing and so in this situation the older investors did better (or lost less) than the newer investors.


Saturday, November 9, 2013

A Buy and Hold Strategy:


According to Investopedia Buy & Hold is a passive investment strategy in which an investor buys stocks and holds them for a long period of time, regardless of fluctuations in the market. An investor who employs a buy-and-hold strategy actively selects stocks, but once in a position, is not concerned with short-term price movements and technical indicators.

This is opposed to the market timers who think you can trade in and out of the market when they get signals from various fundamental of technical indicators.

The key to buy & hold is that it depends on what you buy and hold.

Back in April 2012 the Getting Technical market letter set up a Canadian Multi-Nationals Buy & Hold portfolio (GT letter April 27 2012 #GT1374) based on the assumption that most TSX listed multi-nationals would, over the long term outperform the broader stock indices. At the close November 8, 2013 the selections have returned 62% outpacing the TSX Composite and the S&P500 by a wide margin


Tuesday, November 5, 2013

The Dow Transports at all time highs


Charles Dow. (1851-1902) created both the Dow Jones Industrial Average and the Rail Average (now known as the Dow Transportation Average). It was his work on primary and secondary trends that proved to be the foundation of modern technical analysis.

Dow’s concepts are known to-day as Dow Theory. One concept states that the averages must confirm each other.  Dow argued that no important bull or bear market could occur unless the industrial and the rail (transport) averages gave the same signal or, confirmed the new change in market trend.  In other words both averages had to move above a previous secondary peak to generate a bull market signal. This price “confirmation” by both averages should occur approximately at the same time within a 6 month time window.

On November 4, 2013 the Dow Transports closed at an all-time high above 7100 and well above old resistance at the 6600 & 6700 level. The advance was impressive with 19 of the 20 components up on the day. Conversely the Dow Industrials have spent the last four months trading below resistance at 15700 and have not yet confirmed the “blue sky” position of the Dow Transports.

The bulls will need the Dow Industrials to print new highs over the next several weeks and the bears will need the Dow Industrials to stall here AND have the Transports reverse and drop below the 6600 level. No need to panic because these signals tend to take time to set up

Sunday, November 3, 2013

Covered Call Strategies Protect What?


I have always reasoned that a covered call strategy will for a small premium; provide opportunity for an investor to give away a rising stock and to hold a losing stock.

According to Horizons Investment Management Inc. their HXT Horizons S&P/TSX 60 Index ETF seeks to replicate, to the extent possible, the performance of the S&P/TSX 60 Index (Total Return), net of expenses.

And according to Horizons Investment Management Inc. the investment objective of their HEX Horizons Enhanced Income Equity ETF is to provide unitholders with: (a) exposure to the performance of an equal weighted portfolio of large capitalization Canadian companies; (I assume the HXT) and (b) monthly distributions of dividend and call option income.

Horizons go on to state the HEX will mitigate downside risk and generate income. The HEX will generally write covered call options on 100% of its portfolio securities. Covered call options provide a partial hedge against declines in the price of the securities on which they are written to the extent of the premiums received.

In reality when the two ETFs are displayed an investor may not impressed with the capital performance of the HEX in an “up” market. I can just imagine what this turkey will do in a “down” marke

Thursday, October 24, 2013

Successful Investing vs. Urban Myths


Market timing is a failed strategy – if you wish to add alpha - seek out the current dominant theme: The dominant theme is a period of rapid expansion of an industry group due to innovation or in reaction to changing economic conditions. Investors and portfolio managers who can correctly identify and ride the dominant theme will likely generate several quarters of above market returns.

The first modern dominant theme was the new economy technology boom of the 1980’s and 1990’s that followed the 1973 Arab Oil Embargo. We had the introduction of the PC and the Internet thanks to the humble beginnings of Cisco Systems Inc., Intel Corporation and Microsoft Corporation. Dumb automobiles became smart thanks to fuel injection and computers.

The second modern dominant theme was new millennium emergence of the global economy and the resulting commodity price boom that ended abruptly with the global financial crisis bust of 2007 – 2008. The subsequent recovery from early 2009 has exposed several new dominant themes.

We have had the U.S. housing recovery and the subsequent rebound of the housing and lumber stocks. We have a boom in the aerospace & transport sector driven by a mix of high energy costs and a travel / consumer boom which has the major airlines up grading their fleets along with municipalities up grading their transit networks.

I will address these issues plus a new theme at the Toronto World Money Show. To register follow this link: http://www.moneyshow.com/tradeshow/toronto/world_moneyshow/?scode=033174


Wednesday, October 23, 2013

The NYSE A/D Line Refresher:


According to Stockcharts.com – the Advance / Decline Line (AD line) is one of the most widely used indicators to measure the breadth of a stock market advance or decline. The AD line tracks the net difference between advancing and declining issues. It is usually compared to a market average where divergence from that average would be an early indication of a possible trend reversal

They say a picture is worth a thousand words so I will let my chart do the taking. The upper plot is the S&P500 and the lower plot is the NYSE A/D line which is just now breaking up and out of a large ascending triangle to confirm the new highs on the S&P500. Ignore the doom and gloom crowd for now.


Saturday, October 19, 2013

Sector Rotation Refresher:


A clip from Getting Technical letter - Interim Update October 7, 2013 GT1413 a refresher on using natural stock sector rotation: The various stock sectors advance and decline in reaction to the expansion and contraction of the business cycle. Typically the “front end” of the market – the Financial, Telecommunications Services and Utilities begin to rise in anticipation of improving business conditions and a low interest rate environment. This stimulates the “middle” of the market and the Technology and Industrial stock sectors begin to rise in anticipation of improved corporate spending. The growing demand for goods stimulates the need for raw materials and the “back end” of the market – Materials, Mining and Energy, begin to advance

As the economy expands, inflation fears trigger higher interest rates and the “front end” of the market peaks in anticipation of a slowdown in consumer spending. As the slowdown becomes evident the “middle” sectors peak as industrial demand slows eventually dragging down the lagging commodity sensitive “back end” stock sectors.

Sector                                     #         
Financials                                Leading - Interest rate sensitive
Telecommunications Service Leading - Economy sensitive
Utilities                                     Leading - Interest rate sensitive
Consumer Discretionary        Coincident - Economy sensitive
Consumer Staples                  Coincident - Defensive
Health Care                             Coincident - Defensive
Information Technology          Coincident - Economy sensitive
Industrials                                Coincident - Economy sensitive
Energy                                     Lagging - Commodity sensitive
Materials                                  Lagging - Commodity sensitive

So here is the problem for the bears – The North American Financials are still leading having posted as a group - new 52 week highs at the close on Friday October 18, 2013. By the way – the last time the SPDR XLF peaked was in May 2007, 5 months ahead of the S&P500 peak of October 2007.


Thursday, October 17, 2013

TSX Energy prints a first 52 week high


There are two basic rules for the new 52 week high/low list. The first new 52 week high will not be the last - and the first new 52 week low will not be the last. Today I see both the BMO Junior Oil Index ETF (ZJO) and the iShares S&P/TSX Capped Energy ETF (XEG) posting new 52 week highs

According to BMO, “The BMO Junior Oil Index ETF has been designed to replicate, to the extent possible, the performance of the Dow Jones North America Select Junior Oil Index, net of expenses. The Fund invests in and holds the Constituent Securities of the Index in the same proportion as they are reflected in the Index.”

In any event the smaller cap ZJO leads the larger cap XEG so watch for the lagging XEG to play catch up and break up above the old September 2012 high.


Wednesday, October 16, 2013

Market Timing is for Dummies


Every day I take a peak at the new 52-week high / low list in order to listen to what the market is telling me. At the close of October 15, Bank of Montreal, The Bank of Nova Scotia, Canadian Imperial Bank Of Commerce, National Bank of Canada, Royal Bank of Canada and the iShares CDN S&P/TSX Capped Financials Index Fund were all printing a new (and perhaps an all time high) 52-week high.

I also see some economy sensitive deep cyclical issues like ATS Automation Tooling Systems, GENIVAR Inc and Magna Intl, Inc at new 52-week highs. Clearly the 2009 - 20?? bull remains in place. Timing this market is for dummies and to bail out of good stocks in hope of buying back cheaper is a failed strategy.


Thursday, October 10, 2013

The overlooked TSX Industrials:


The problem with some of the TSX sub indices is they have no investable investment product (ETF) replicating the sector. Examples would be TSX Health Care, TSX Consumer Discretionary and the TSX Telecom sector. Of course the problem is the ETF manufactures are reluctant to build an ETF around a thin sector such as the TSX Health Care group.

Here is the problem – I believe the TSX Industrial Index just printed today a new 52-week high and an all-time high – and thanks to the TSX web site there is no data on this. Yahoo Finance has some info but you have to do some work to confirm an event that is basically ignored by the business media AND the TSX web site.

Now there is an obscure investment product that allows investors to participate in the TSX Industrials - which by the way is a deep sector with 23 components. That obscure investment product is the TSX listed BMO S&P/TSX Equal Weight Industrials Index ETF (ZIN) which yesterday traded 240 shares.

Wake up investors – this thing is the only thing out there for getting into the Industrials.

Please – no worries about liquidity – the ZIN is an open ended trust and so the market makers are deep on both sides of the net asset value.


Sunday, October 6, 2013

Relative Averages Explained:


Relative Strength (not to be confused with the RSI indicator) is a measure of price trend that indicates how a stock is performing relative to other stocks in its industry.  We can also measure the relative performance of each component of any index. Relative strength is typically a numerical measurement expressed as a percentage. For example, if a stock has a relative strength of 75 it has outperformed 75% of the stocks over a specified period.

Investor’s Business Daily publish their Relative Price Strength Rating that appears for each stock is calculated by comparing its price change over the past 12 months to that of all other stocks in the tables. Results are rated on a scale from 1 to 99, with 99 being best.

At Getting Technical our approach is unique in that we use Relative Analysis (RA) to measure the price performance of a stock vs. the price performance of an appropriate index over several time periods. Note our Air Canada weekly vs. the TSX 60 Index weekly This methodology allows us to scan of filter based of six relative conditions –.

Bottoming:
Early Out-perform:
Established Out-perform:
Topping:
Early Under-perform:
Established Under-perform:

In a filter / scan date Oct 4, 2013 for bottoming TSX listed stocks some symbols selected were ABX, ATH, ATP, EDR, HBM, SLW, T and TGL.


Friday, September 27, 2013

Aerospace is a dominant theme:


Dominant theme investing has been my focus for the last several years starting with the “echo” technology boom and then on to lumber and now aerospace. These sectors are still in youthful secular bull phases.

Below is the text I authored and published by the Toronto Star business on or about September 7, 2013.

----------------------------------------------------------------------

Traditionally financial planners and investment advisors have embraced two basic rules when advising clients on personal finance and equity investing

Never get divorced, and never buy an airline stock.

The never buy an airline stock rule is deep rooted and for good reason.

Investors have long nightmare like memories when it comes to the North American airline industry. In Canada we have infamous names like Air Canada, Wardair. Canadian Airlines, Zoom Airlines and Canada 3000. In the U.S. the list is too long for this space.
Industry experts have blamed the carnage on de-regulation, rising fuel costs, security costs and various global crises such as the technology bubble of 2000 and the financial crisis of 2008.

The AMEX Airline index (XAL) which is designed to measure the performance of highly capitalized companies in the commercial airline industry peaked in 2000 at the 160 level. By March 2009 the XAL was trading at the 16 level for a stunning loss of 90 per cent,
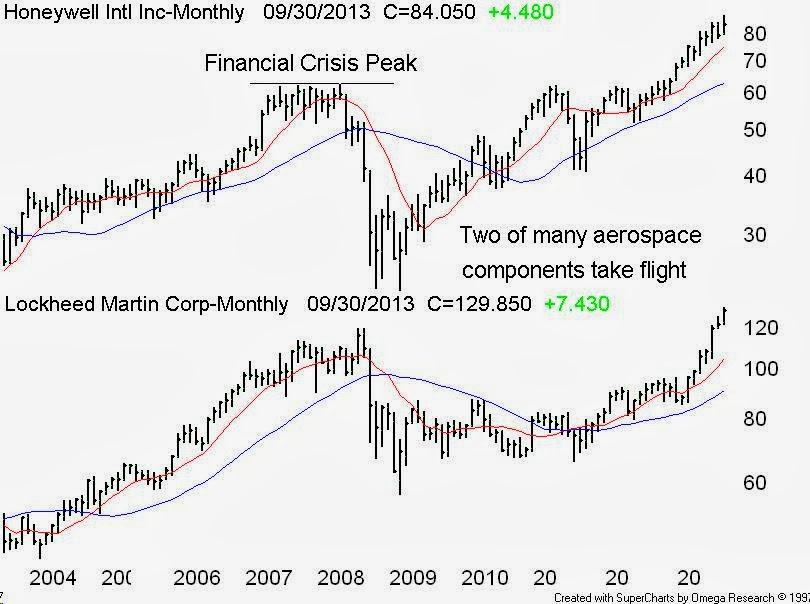
The dismal performance of the XAL is in sharp contrast to the success of the related commercial and defence manufactures and contractors. Names like he Boeing Company (BA), Honeywell International Inc. (HON) and United Technologies Corp. (UTX) are trading close to recent all-time highs.

Most notable is the list of the top North American manufacturing employers. Names like General Electric Company, General Motors Company, United Technologies Corp, Ford Motor Co., The Boeing Company, Lockheed Martin Corporation and Honeywell International Inc. are all related to trains, planes and automobiles,

The common theme among most of these names appears to be related to aerospace and made in North America.

Loosely defined, aerospace is branch of technology and industry that is shared by three major components, the defence industry, commercial aviation and space exploitation programs such as spaceships and satellites.
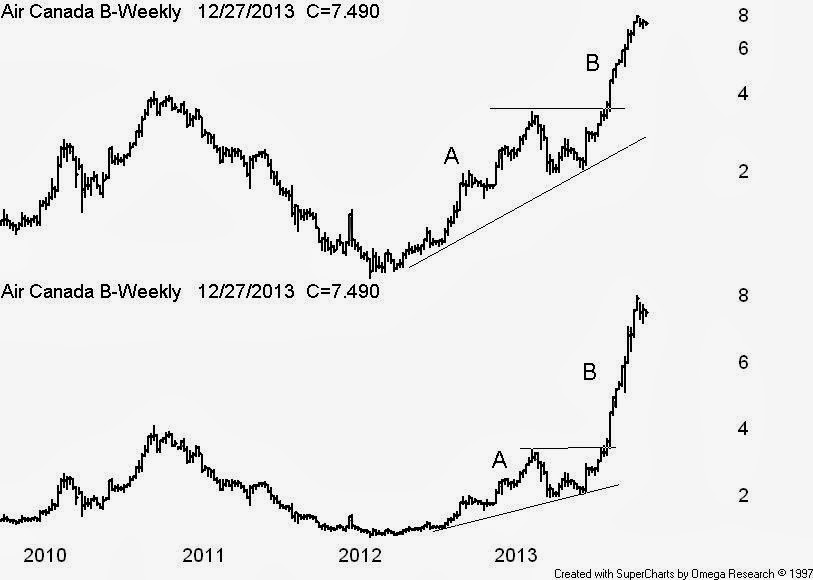
Bullish Investors in the aerospace sector have lately chosen to ignore that never buy an airline stock rule. In the U.S. the AMEX Airline index has soared 300 per cent from the March 2009 lows and locally Air Canada and WestJet Airlines Ltd, were among the top performers on the TSX in 2012.

According to Standard & Poor's Capital IQ global air traffic trends are looking positive. They claim the underlying drivers of the commercial aerospace industry are improving global economic growth, an emerging global middle class and the upgrade of an aging fleet of commercial aircraft.

The commercial and defence manufactures are awash with orders from airlines switching to new aircraft.

Some recent Canadian examples would be WestJet Airlines Ltd (WJA) reaching a preliminary agreement to purchase 65 737 MAX aircraft from Boeing Co (BA), and Bombardier Inc. (BBD.B) recently signing a letter of intent to sell 50 Q400 NextGen turboprop aircraft to the Russian state-owned industrial and defence conglomerate Rostec.

If an investor embraces the aerospace theme he or she will need to seek out the companies or investment products that will provide some exposure to the sector

In other words we need to engage in stock picking or seek out sector related exchange traded funds (ETFs).

At the moment there appears to be no commercial airline industry ETFs that would track the AMEX Airline index (XAL). Guggenheim Investments closed nine ETFs back in March 2013 due to lack of investor interest. One of them was the Guggenheim Airline ETF (FAA) which could be goods news to a contrarian investor.

In the U.S. there are several ETFs that will provide direct exposure to all components of the aerospace sector.

The NYSE listed iShares Dow Jones US Aerospace & Defence ETF (ITA) tracks the Dow Jones U.S. Select Aerospace & Defense Index. It has 33 holdings, to include stocks like United Technologies Corporation (UTX), Boeing (BA), Goodrich Corporation (GR) and Lockheed Martin (LMT).

Also listed on the NYSE is the PowerShares Aerospace & Defence ETF (PPA) which tracks the SPADE Defense Index. It has 51 holdings, to include Honeywell International (HON), United Technologies Corporation (UTX), Lockheed Martin (LMT) and Raytheon Corporation (RTN).

Here in Canada the ETF manufactures have avoided the space and so we have to engage in stock picking.

Currently there are only five TSX listed companies in the aerospace sector, CAE Inc. (CAE), Magellan Aerospace Corporation (MAL), Bombardier Inc. (BBD.B), MacDonald, Dettwiler and Associates Ltd. (MDA) and Héroux-Devtek Inc. (HRX)

Some of these names may not be suitable investments and you may need the advice of a fully licensed advisor before making an investment decision.