Why
do you always use a semi-log scale in your charts? This is a question I always
get during a teaching session. Usually the students are industry pros who surprisingly
are not clear on the choice between a linear or semi-log (percent) scale.
The
old rule among technical analysts used to be if the data doubles use a semi-log
scale but now many will use a 50% price range before the switch from linear to
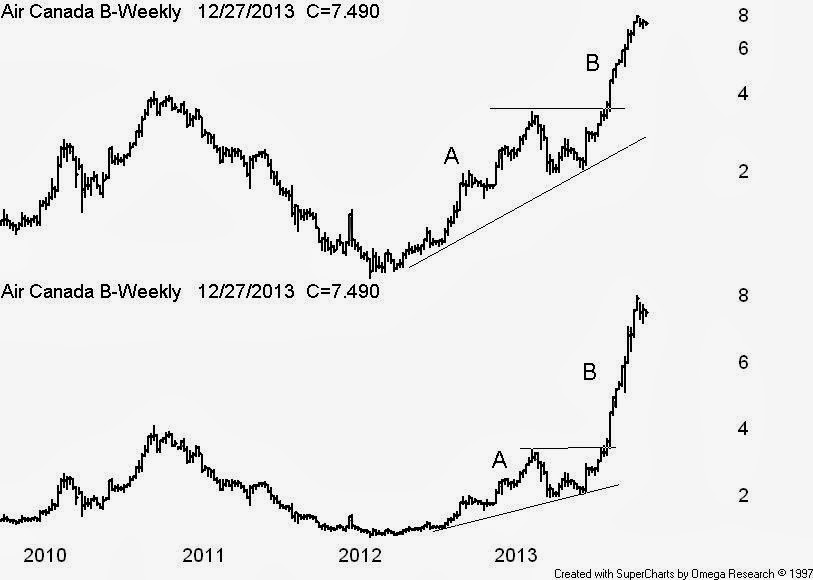
semi-log. I always use a semi-log - see the Air Canada chart example.
On
the lower linear scale it appears the advance at B is greater than the advance
at A which is not true. The above semi log clearly displays the A & B
advances to be about equal in price change. Also never draw trend lines on a
linear scale. This is a common error even among CMT’s that should know better.


2 comments:
I like the simplicity of your charts. Where can I find this "Super Chart" software so I can create my own charts.
Mike in Winnipeg
Hello Mike
Supercharts was written by the TradeStation people but as an old 16bit program will only run on WindowsXP and not Win7 or higher
You could try MetaStock - I also use it but find it not user friendly
Bill C
Post a Comment