Sunday, April 4, 2010

David Rosenberg vs. the Equity Markets

Google “The Dow Industrials 1929 vs 2010” and you end up with pages of historical comparisons between the Crash and rebound of 1929 and the current “rally”. David Rosenberg economist and strategist for Gluskin Sheff + Associates Inc., and a guest columnist for Report on Business authored yet another comparison item entitled “Current rally has echoes of 1930 snapback” Wednesday's Globe and Mail March 31, 2010. I initially brushed off the item to be just another bear (who has missed out on the big 2009-2010 advance) who is arguing with the markets in a public forum but the weak technical arguments grabbed my attention and I quote.

“Not only is the U.S. equity market overvalued by more than 25 per cent, it is also extremely overbought, having gone 24 sessions without a decline of 1 per cent or more. Moreover, 89 per cent of the stocks in the S&P 500 are now trading above their 50-day moving averages - and volume remains tepid at best.”

And:

“From our lens, the rally of the last 12 months smacks of the 1930 snapback, and if I'm not mistaken the S&P went on to hit new lows in subsequent years and the next secular bull market did not start until 1954.”

And:

“The theory that the stock market has turned in a "double top" may not have gone the way of the dodo bird after all, following the reversals we saw in the last two trading days of last week”.

Before I continue we need a little background on the structure of the 1929 Crash. The Dow entered the “Roaring Twenties” running up non-stop from an October 1923 low of 85.70 to peak at 381 In September 1929. From there the Dow plunged 48% to 198 in just 71 days to bottom in November 1929. The following recovery wave – or bear market rally lasted 155 days to peak at 294 on April 1930 for a gain of 48%. The final down wave lasted 800 days taking the Dow to a low of 41 in July 1932 for a loss of 86%.

In terms of Elliott Wave we had an A-B-C corrective bear with the low at C (July 1932) the point of origin for the famous 20th century Supercycle Wave as set out in the respected publication - Elliott Wave Principle by Frost and Prechter. In other words the July 1932 low was the Buy-of-the-Century. I should also mention that Rosenberg refers to the S&P which was not published until 1957.

Ok now I admit to being no match for Rosenberg the economist although I did study Paul A. Samuelson’s – Economics An Introductory Analysis at my first year at Ryerson University but - I also studied the works of Ian S. Notley, Martin Pring, Frost & Prechter and John J. Murphy. Now if there is one thing history has taught me about the capital markets it would be - an economist should never manage money - because they are always mucking about in ancient data that has no relevance to the equity markets that are always pricing “valuations” on what will happen and not on what has happened.

First lets examine the “From our lens” stuff with the overbought comment and the observations relating to the 50-day moving averages. The 50-Day MA is a trading tool that generates over-bought and over-sold signals about every 15 days and an experienced technician would never compare a short term trading condition to a much larger November 1929 to April 1930 recovery wave that spanned 155 trading days

Next Rosenberg supports the theory that the stock market has turned in a "double top" – sorry but where? Would that be the 2000 and 2007 peaks of the S&P500? Certainly not the Dow Industrials, the Dow Transports, the Russell 2000 or the TSX Composite. Now about those reversals we saw in the last two trading days of last week (I assume the week ending March 26, 2010). One day reversals are for day traders. Is Rosenberg actually using a one day reversal to support his “echo of 1930 theory?

Now I think Rosenberg’s economic arguments have merit when he claims - “the current rebound in the economy is a statistical mirage orchestrated by record amounts of monetary and fiscal stimulus that are simply unsustainable and actually risk precipitating a very unstable financial and economic backdrop in coming years.” I do however think Rosenberg is getting poor advice on the technical side because to-day’s technical picture has no relevance to the 1929 – 1932 technical structure.

The 1929–1932 bear was of 34-months in duration and we are now into month 30 following the last modern October 2007 bull peak of the S&P500. That means to-day’s S&P500 has only 4 months to fall from the current 1178 level to below the March 2009 low of 666 in order to mirror or “echo” the 1929-1932 bear. In addition the current “flashy bear market rally” is in fact a bull market because we are into month 13 above the March 2009 low. No bear market has ever failed to break to new lows within a 12 month window.

The real technical problem (too bad Rosenberg never gave me a call) is the price of crude pushing above $80. Note the long term monthly chart of the Dow Industrials plotted above the price of crude and note the modern trading range of crude the North American markets can tolerate because of peaking crude consumption due to alternate sources and more fuel efficient autos combined with muted long term growth prospects. Forget 1929 – right now the last thing we need is another 1973 style energy price shock

Sunday, March 28, 2010

Rob Carrick Loves Active ETFs

Rob Carrick is truly a writing machine. Week after week this guy manages to fill two thirds of a page of the Saturday Globe’s Report on Business with “interesting” observations investment products, investment strategies and educational timbits. Personally I don’t read Carrick because aside from the space hogging fancy artwork and data tables I find the content repetitions and shallow. The bottom line is I never could apply Carrick’s material to make an dollar in the markets but I guess his job is to play it safe and keep his employer out of trouble

His latest piece - last updated on Saturday, Mar. 27, 2010 “Almost all the things you don't like about mutual funds have been fixed in a new investing product called the actively managed exchange-traded fund.” I was curious to see his logic to support his profound “mutual funds have been fixed” claim.

Carrick leads with – “But now there's a different type of ETF – one that does exactly what conventional mutual funds do, but without the high cost and impediments to convenient buying and selling.

Question: Don’t all ETFs avoid the high cost and impediments to convenient buying and selling?

Carrick: - “Actively managed ETFs were introduced in Canada by Horizons AlphaPro in early 2009 and the reception was unenthusiastic. I wrote a column dissing them on the basis that many fund managers can't beat their benchmark indexes, a point that highlights the benefit of the traditional index-tracking ETF.

Question: So how come 12-months latter we now decide managers can beat their benchmark indexes?

Carrick: - “The actively managed ETF market has evolved in 2010, and so has my view. With some quality managers being recruited to run these ETFs, I think they have the potential to be one of the most significant retail investing developments in years.

Question: Aren’t these managers being recruited from the same fund industry that “needed to be fixed?”

Carrick: - “Subpar managers are easy to find in the mutual fund world – that's precisely why conventional index-tracking ETFs have become such a fast-growing product. But savvy investors know there are some managers who are worth putting to work in your portfolio. Actively managed ETFs are a smarter way to access these managers.

Question: If an active mutual fund manager is so good, why then work for less for an ETF manufacturer?

Carrick: - “Let's start with fees. The management expense ratios for five of the AlphaPro active ETFs is 1 per cent, while two others come in around 1.25 per cent. In addition, performance fees are charged if the funds beat specific benchmarks.

Question: How come Carrick fails to explain the 20% performance fee?

Carrick: - “A major reason why active ETFs cost less to own than mutual funds is that their fees do not include a component that is intended to compensate investment advisers for the counsel they provide clients. This so-called trailing commission accounts for one percentage point of the typical equity fund's MER and 0.5 points for the average bond fund.

Question: Is not a 1% trailer less than a 20% performance fee?

Carrick: - “Imagine you want to sell a fund with the market soaring at midday. You can do that with an actively managed ETF, whereas a fund exposes you to the risk that the market will pull back or even decline later in the day. When buying, you can take advantage of a dip to place your order.

Question: If the ETF is managed by a “quality manager”, how come we are now trading during “soaring at midday” and taking advantage of a dip to place your order? Are we not just to buy-and-hold and let the “quality manager” make those decisions?

Carrick: – “Because active ETFs are traded like stocks, you can use a limit order to set a ceiling on what you'll pay and a floor on what you'll accept when selling. You can also use a stop-loss order to liquidate your holding if the price falls through a certain threshold.”

Question: Are you suggesting we place restrictions such as ceilings and floors and stop losses on a “quality manager”?

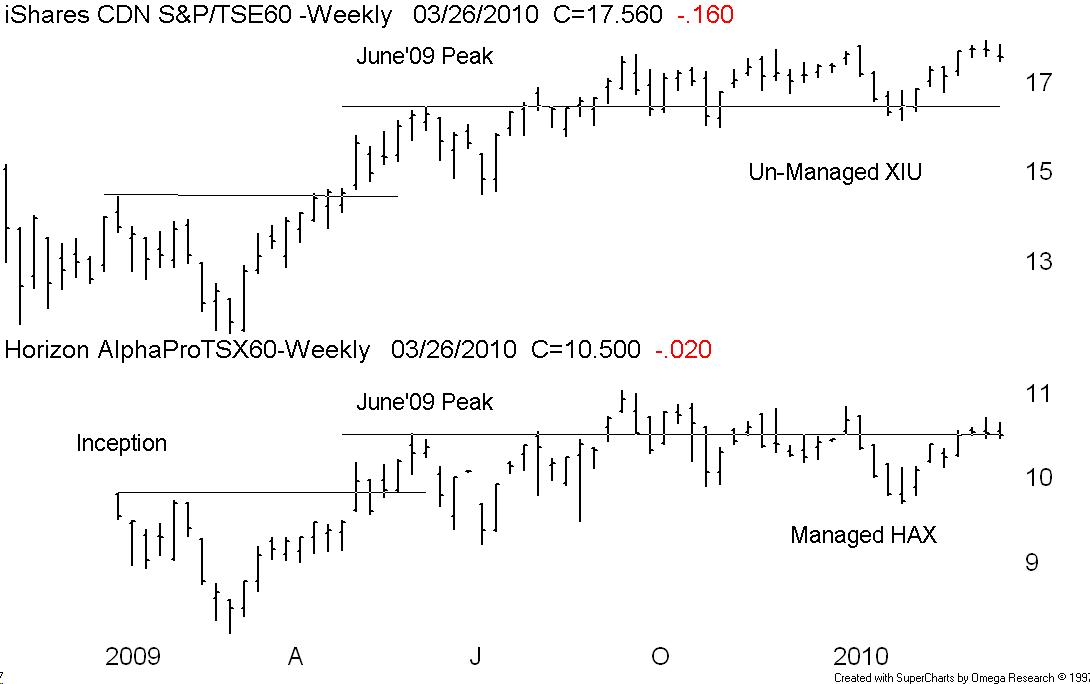
Carrick: - “Here's a list of TSX-listed ETFs that use a manager to pick securities rather than following the traditional ETF strategy of tracking an index. All are part of the Horizons AlphaPro family.”

Question: If you can produce a list how come you don’t produce a track record?
By the way - Don Vialoux, Brooke Thackray, Dennis Gartman, Frank Mersch, Prakash Hariharan, Steve Rogers¸ Lyle Stein and Vito Maida are all sub-advisors to these products and not the fund managers as set out in the Carrick tables.

Tuesday, March 23, 2010

The 40-Week Moving Average Rule

This is a clip from a piece I wrote for the Canadian Securities Institute way back in April 2006
--------------------------------------

The 40-Week Rule:

The 40-week moving average (MA) is an industry standard for identifying trends. Keep in mid the 40-week on a weekly chart is the same as the 200-day on a daily chart. The rule is quite simple, if the PRICE is above the MA and the MA is pointed UPWARD, the trend is up. The trend is down if the PRICE is below the MA and the MA is pointed DOWNWARD.

I will also use the 40-week or 200-day MA to gage volatility and support levels.

Up trends and down trends in stocks can persist from several weeks to several years. A stock in an uptrend such as Dow component Boeing Co. will advance upward above its 40 week MA in a zigzag motion caused when it runs upward from the MA corrects down to the MA and then repeats the pattern over and over until the up trend comes to an end. Investors who are long the stock may reduce when the stock is “too far” above the MA and subsequently re-acquire the stock when it returns to support at the MA. New investors should never buy a stock when it is “too far” from the MA but rather enter when the stock returns to the MA. The problem is to define what “too far” is in terms on per cent.

What we are actually doing here is measuring volatility. I have found that volatility is normally higher in the micro-cap technology and resource stocks that typically trade under $5. It is not unusual for a copper or gold exploration company to trade up to 100% to 150% above the 40-week MA before a corrective period sets in.

A mid-cap industrial will rarely run above 50% above the 40-week MA and the larger caps will rarely run 20% above the 40 week MA and stock indices usually max out at the 10% level above the MA
------------------------------------------------------

To-day we will look for any stock that “returns to support at the MA” and fails to rebound by breaking down under the 40-week MA and possibly setting up a new down trend. A filter run last night at the close of March 22, 2010 selected over 25 issuers over the price of $3 that have just traded under their 40-week or 200-day MAs. To my surprise the list was populated by gold stocks. In other words we have a birds-of-a-feather sector failure. One example is Goldcorp a stock that is owned and loved by the BNN “experts” as set out on http://www.stockchase.com/Company-sl--slq-ID-slv-Goldcorp--Inc.php

One wonders if they all own and love Goldcorp, who is left to buy?