Frightened money has also been bidding up the U.S. T-bonds driving prices up and yields down to historical levels. The U.S. 10-year Treasury note has become the security most frequently quoted when discussing the performance of the U.S. government-bond market and is as such can be regarded as a bellwether to convey the market's take on longer-term macroeconomic expectations.
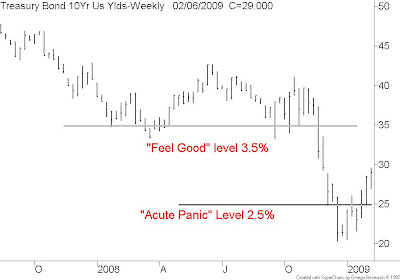
Our chart this week is that of the weekly closes of the YIELD on the U.S. 10-year Treasury note. Keep in mind that the bond yield and the bond price operate inversely and so when the yield hit a historical low back in December the bond price was at a historical high.
I have placed a horizontal support line at the 3.5% yield level on the chart to represent the “feel good” level of support that goes back to support at the prior lows of 2002-2003. You will recall that during the bear market lows of 2002 and 2003 there was also great investor fear and terrible economic fundamentals. We had two New York towers vaporized, war in Iraq and the Enron & accounting fiascos.
Note the November breakdown on the yield as nervous investors stampeded into the T-bonds driving the yield down under the “acute fear” level of 2.5%.
The good news now for equity investors is the rebound in the yield back up to the 3% level which to me suggests a reduction of investor fear and the willingness to increase their risk appetite.
I think we get a green light on equities when that 10-year yield finally pops above 3.5%


1 comment:
What do you think of the possible inverse Head and Shoulder Bottoms for both POT and AGU?
Both necklines broken but on relatively low volume. I'm guessing both will fail but never say never.
CM
Post a Comment