According to on-line book retailer John Wiley & Sons Inc (Public, NYSE:JW.A) the Commodity Trader's Almanac 2010 (Jeffrey A. Hirsch, John L. Person) is available in Canada for $47.95. They describe the publication to be “an indispensable resource for active traders from the Hirsch Organization and John Person. Provides the best in investment data and statistics, in the same calendar format as the trusted annual Stock Trader's Almanac (and) The Commodity Trader’s Almanac 2010 is your annual guide to commodities trading. Whether you’re a seasoned investor or just getting started in commodities this vital desk reference is packed with critical commodity trading seasonality trends, strategies and data for every active trader. I acquired my first copy in 1984 and manage to pick one up every five years or so because books on seasonality tend to be repetitious as they replicate the same information year after year.
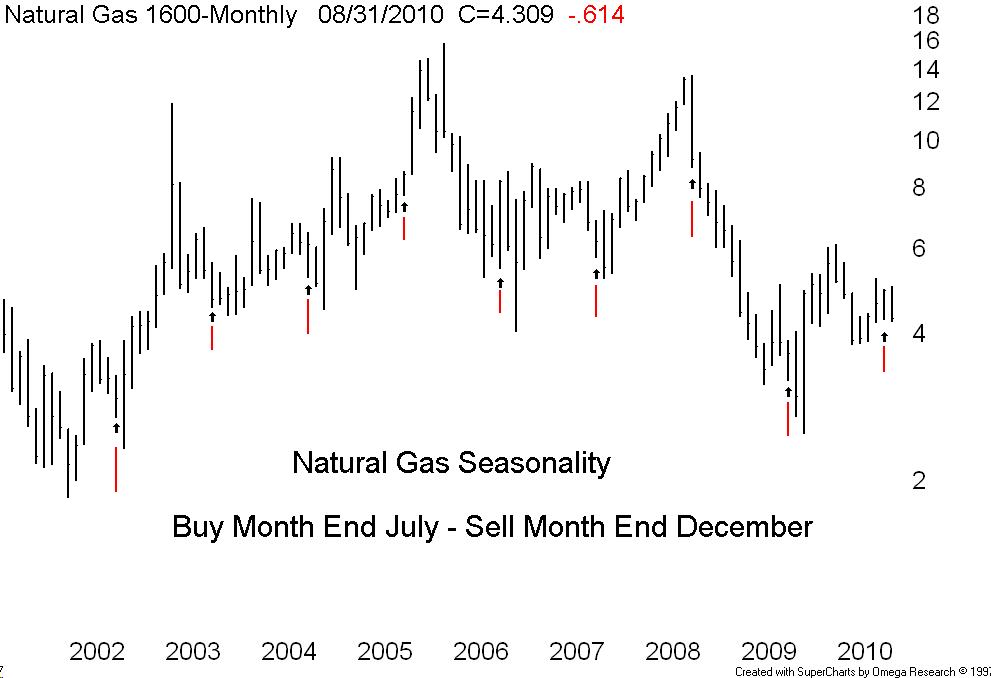
Currently natural gas prices are frustrating many investors as the recent down turn has once-again delayed a possible recovery – although technically we are still printing a bullish rolling series of higher lows. In desperation I looked into the seasonality aspect of the trade and according to the Almanac the best time to own gas is between August and December. Our chart is the monthly bar chart of natural gas spanning about 9-years. I have marked the July close with an “up” arrow with a red tail to identify the buy points. We are supposed to sell 5-bars later at the close of December. Note the advance from 2002 to 2005 – every time we sell high we end up buying in at even higher prices. The down of 2008 had us buying low and selling at even lower prices. I think I will stick to my bullish higher low scenario.


2 comments:
Hi Bill. I appreciate and agree with your view that seasonality is not a reliable investment tool. Unfortunately, it statistically does work some of the time. I'm concerned that this year is behaving very much like a typical mid-term election year. If the rest of this year plays out according to a typical mid-term election year, we will likely post new 52-week lows by the end of September. This could take us down to 950 on the S&P. Where do you see the market going over the next 6 months? Should I be buying puts?
Hello
Good observation - I am covering this mid-term issue on BNN on Thursday and in the Toronto Star this Sat - I have posted a comment on my web site follow this link: http://www.gettingtechnical.com/04_analysis/01_filters.shtml
Bill Carrigan
Post a Comment