The usual definition of a bear market is that a bear
market happens when stocks decline at least 20 percent from their peaks. A
correction is when stocks fall 10 percent. According to Ned Davis Research
during a study period from January 2, 1900 through December 31, 2010, big
corrections in the Dow Jones Industrial Average are actually quite rare.
Dips of 5 % or more totalled 378 or 3.4 per year
Corrections of 10 % or more was 122 or about 1 per
year
Bear declines of 20 % or more was 32 or about I every
3.5 years
At Getting Technical our historical market studies
dictate that bear markets print a lower low within a rolling 26 to 30 week time
window.
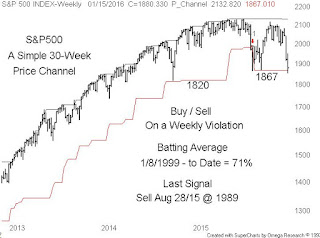
Our chart – is a weekly of the S&P500 bounded by
a simple 30-week high low price channel. Bull and bear or buy and sell signals on
a weekly violation at the close – interim violations are ignored. The current
bear in the S&P500 was signaled last August 2015 at the 1990 level. An
Elliott Wave A-B-C bear suggests at least two downward violations of the lower
price channel with this week testing the first 1867 level of the bottom price
channel and then the second and final drop down to support at the October 2014
low at the 1820 level.


3 comments:
Do you think 1820 on the S&P 500 is the bear market low?
Shawn
Good analysis. I hope you're right.
:)
Shawn
Hi guys
Yes I think 1820 is a major support level
Bill C
Post a Comment